Dataset Cleaning
In this lesson you will clean datasets using Pandas and Numpy.
Setup
Now that you have learned the different steps of data cleaning, let's apply it to some datasets.
We have already done some cleaning in the 'Intro to Python Course' with Pandas, but we will do some more detailed cleaning here.
First create a new project in Spyder and save it as DataCleaning.
Then, create a new file inside the project and save it as cleaning.py.
You can also delete the text that's already in the file.
Next, create a sub-folder in DataCleaning and name it Datasets. This is where we will store our dataset files.
You can create a new sub-folder by right-clicking the original folder > New > Folder... and then naming the folder.
Now download the datasets that we will be using for this project and save them into the Datasets folder.
BL-Flickr-Images-Book.csv - A CSV file containing information about books from the British Library.
university_towns.txt - A text file containing names of college towns in every US state.
olympics.csv - A CSV file summarizing the participation of all countries in Summer and Winter Olympics.
In your cleaning.py file, import pandas as pd and numpy as np.
import pandas as pd
import numpy as np
Spyder may give you warning symbols before each line number. It is just letting you know that the modules are imported but not used so no need to worry.
Now we're ready to start cleaning data.
Dropping Columns
When cleaning datasets, we need to remove information that isn't useful.
For example, in the dataset about books, there are columns such as: Corporate Author, Engraver, Issuance Type, etc. which do not do describe the books themselves.
You might want to keep these columns if you want those details, but when you start to clean up data you should only keep the columns you intend to use for your analysis. In our case, we will remove columns that refer to those intricate details of the book and only keep the useful columns for our needs such as: Title, Author, Publisher, etc.
First, create a DataFrame using the CSV file 'BL-Flickr-Images-Book.csv'.
import pandas as pd
import numpy as np

df = pd.read_csv('Datasets/BL-Flickr-Images-Book.csv')
Here we use a relative path to find the file. We first go to the Datasets folder, then go into it using /, and find the csv file.
Then print df.head(n) which gets the first n rows of the dataframe.
In this case, we will not pass in a value for n so df.head() will return the first 5 rows by default.
df = pd.read_csv('Datasets/BL-Flickr-Images-Book.csv')
print(df.head())
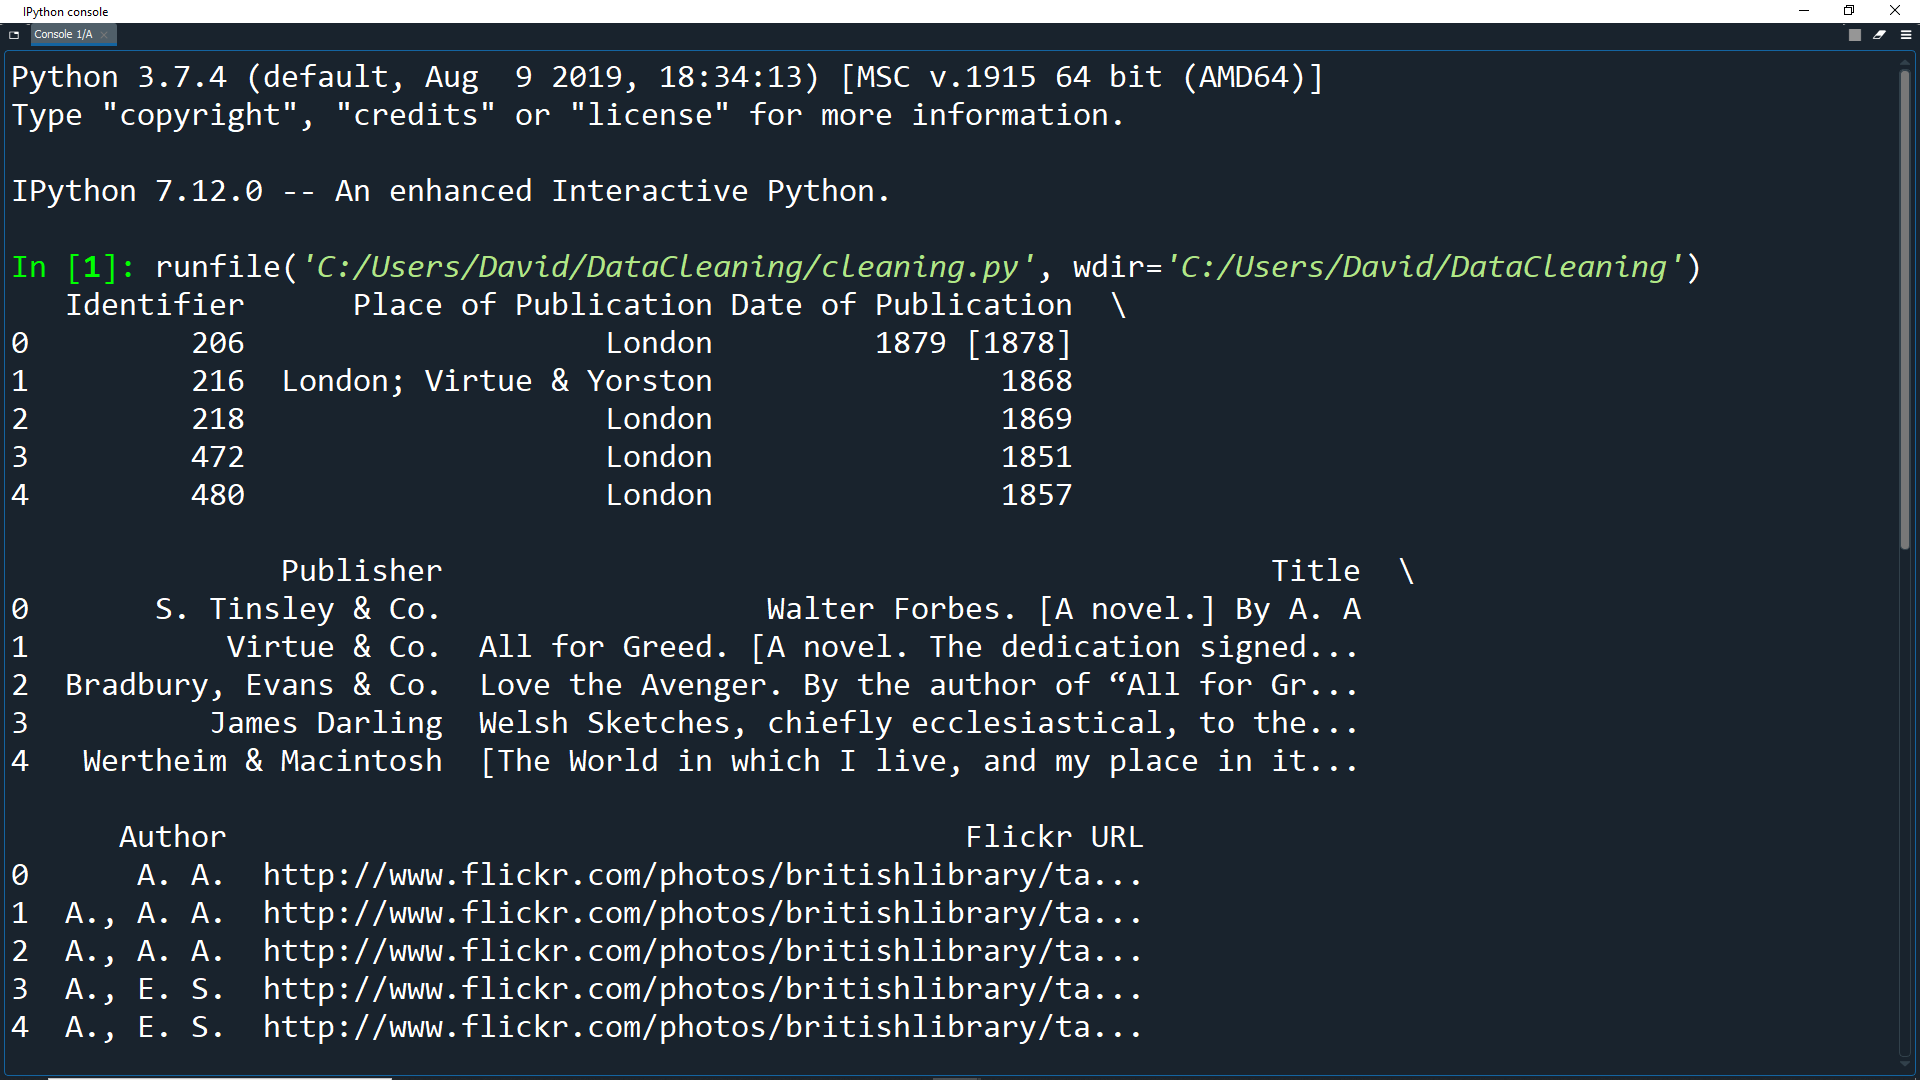
Run the program and you should see data for the first 5 rows in the IPython Console.
By default, Pandas will only show a few columns just in case you have a huge file.
In our case, we want to see all of our columns. We can do this using the Pandas options attribute.
Write this at the top of your file (but under the imports) to have no limit on the maximum number of columns to display.
import numpy as np

pd.options.display.max_columns = None

df = pd.read_csv('Datasets/BL-Flickr-Images-Book.csv')
print(df.head())
Now run the program again and you should see the first five rows for every column.
Looking at the first five entries, you can see that some columns provide extra information useful in some cases, but not very descriptive of the books themselves.
These columns are: Edition Statement, Corporate Author, Corporate Contributors, Former Owner, Engraver, Issuance Type and Shelfmarks.
Since we do not need these columns, let's drop them!
First, create a list of the names of the columns we want to drop.
df = pd.read_csv('Datasets/BL-Flickr-Images-Book.csv')

to_drop = ['Edition Statement',
           'Corporate Author',
           'Corporate Contributors',
           'Former owner',
           'Engraver',
           'Contributors',
           'Issuance type',
           'Shelfmarks']
Then use the drop() function on our dataframe, passing in the list of columns to drop.
We also set the inplace parameter to True and the axis parameter to 1.
The inplace parameter means that the dataframe will be modified when the drop action occurs. If you wanted to save your original dataframe and not change it, you could set inplace=False and then assign the output of the drop function to a new variable.
The axis parameter determines whether the drop will be occurring on rows, or columns. If you set axis=0, it will drop rows with those label names. In our case, because we want to drop columns with these names, we use axis=1.
This tells Pandas that we want the changes to be made directly to our dataframe and it should look for the values to be dropped in the columns (not the rows) of the dataframe.
df = pd.read_csv('Datasets/BL-Flickr-Images-Book.csv')

to_drop = ['Edition Statement',
       'Corporate Author',
       'Corporate Contributors',
       'Former owner',
       'Engraver',
       'Contributors',
       'Issuance type',
       'Shelfmarks']

df.drop(to_drop, inplace=True, axis=1)

print(df.head())
Now print the df.head() again and you will see the unwanted columns are gone.
Another way to use the drop() method is to pass in the list to the columns parameter so you don't need to specify the axis.
df.drop(columns=to_drop, inplace=True)
This syntax is more intuitive and readable in some cases, but it is good to know both methods for the data cleanup code you might read in the future.
Changing the Index
When we search for data in a Pandas dataframe, we use indexing. Indexing is extended from NumPy arrays.
Instead of just using 0-based integer indexing, it is better to use a unique field of the data as an index.
For the books dataframe, we will want to use the Identifier column to index each entry.
First, let's check that each value in the Identifier column is actually unique.
print(df['Identifier'].is_unique)

# Output: True
Now that we know it a unique field, you can delete this print statement.
Let's replace the existing index with this column using the set_index() method.
df = df.set_index('Identifier')
By default, the set_index() method doesn't directly change the object, it instead creates a modified copy. Therefore we reassign the df variable with the copy which has the Identifier column as the index.
Instead of reassigning the variable, we can make the function directly modify the object by setting the inplace parameter.
df.set_index('Identifier', inplace=True)
Once again, print df.head() to see the first 5 rows of the dataframe.
df = df.set_index('Identifier')

print(df.head())
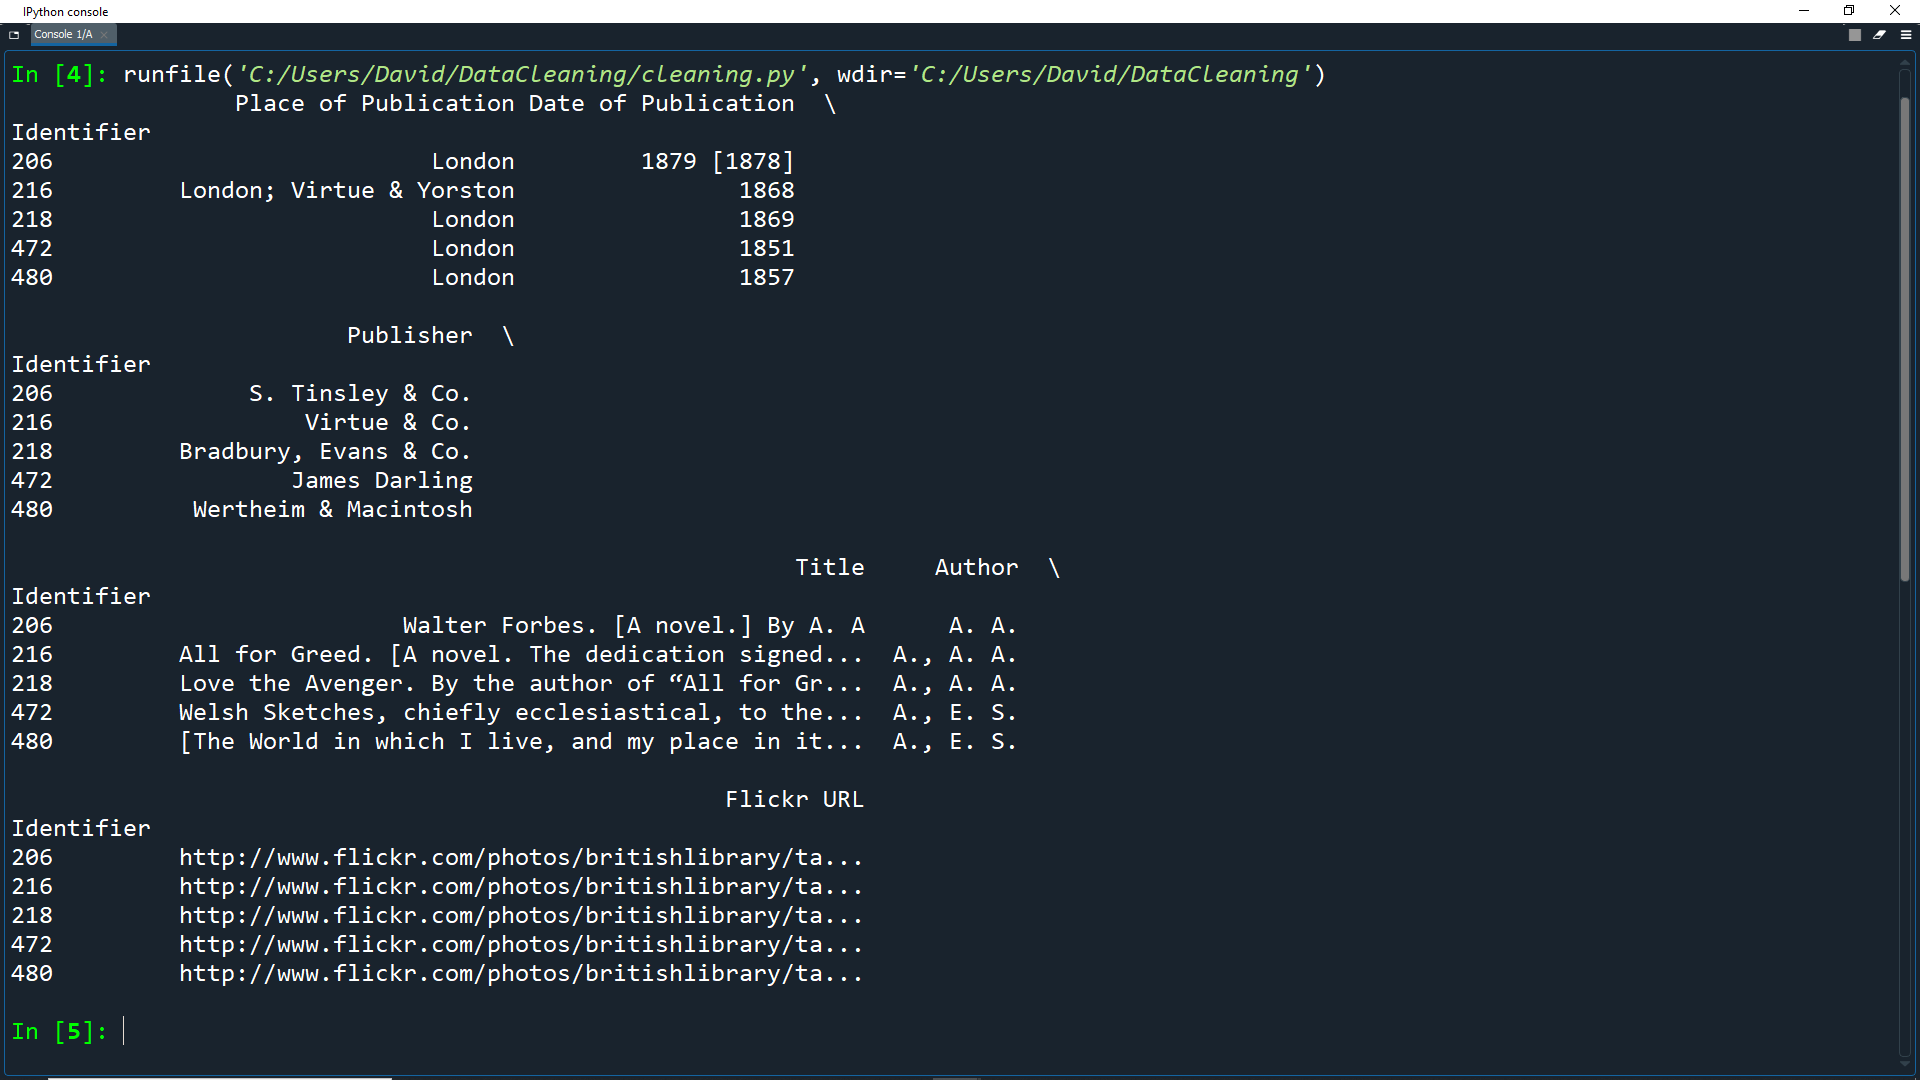
As you can see, the Identifier column has moved to become the new index column.
Now we can access each record with .loc[].
This allows us to do label-based indexing, which is the labeling of a row or record in terms of a label instead of its position.
df = df.set_index('Identifier')

print(df.loc[206])
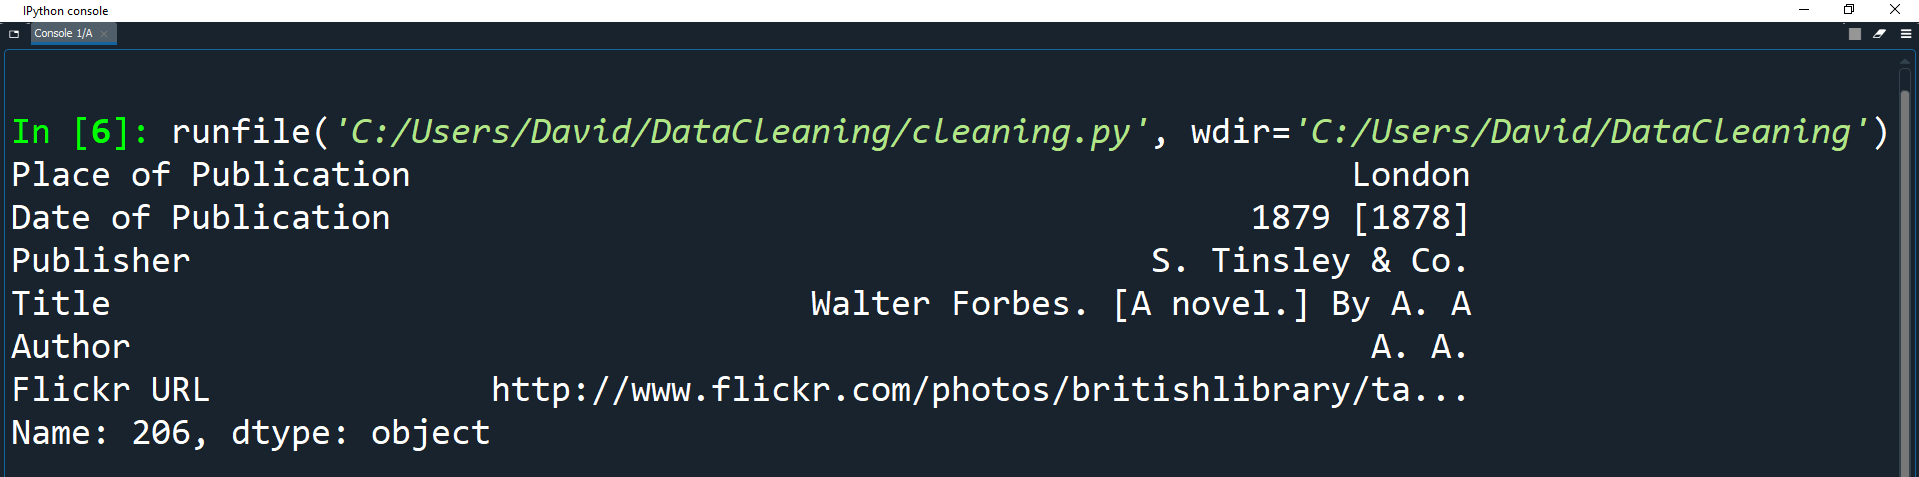
In this example, 206 is the label used to access the first index.
To access it by position instead, we can use iloc[0], which does position-based indexing.
df = df.set_index('Identifier')

print(df.iloc[0])
Indexes help code to run faster over large sets of data. Right now, our datasets are fairly small. Once you try to run code over datasets with millions of rows, you will get a substantial performance improvement if you set up indexes properly.
Tidying Fields
It's time to tidy up our columns so that they have a consistent format.
The columns we will edit are: Date of Publication and Place of Publication.
At the moment, all of the data types in the dataframe are the object dtype. The Pandas object dtype is equivelent to str (string) in native Python.
The object dtype is used for any field that isn't specified as numerical or catagorical data.
Since we read in the dataset as a long string, all fields have the object data type.
print(df.dtypes.value_counts())

# Output:
# object     6
We can start by changing the dtype of the date of publication field so that it has numeric values.
This will allow us to do calculations with this data later.
Let's see what this field currently looks like.
print(df['Date of Publication'].head(25))
Here we get the first 25 entries of the dataframe and only show the Date of Publication field.
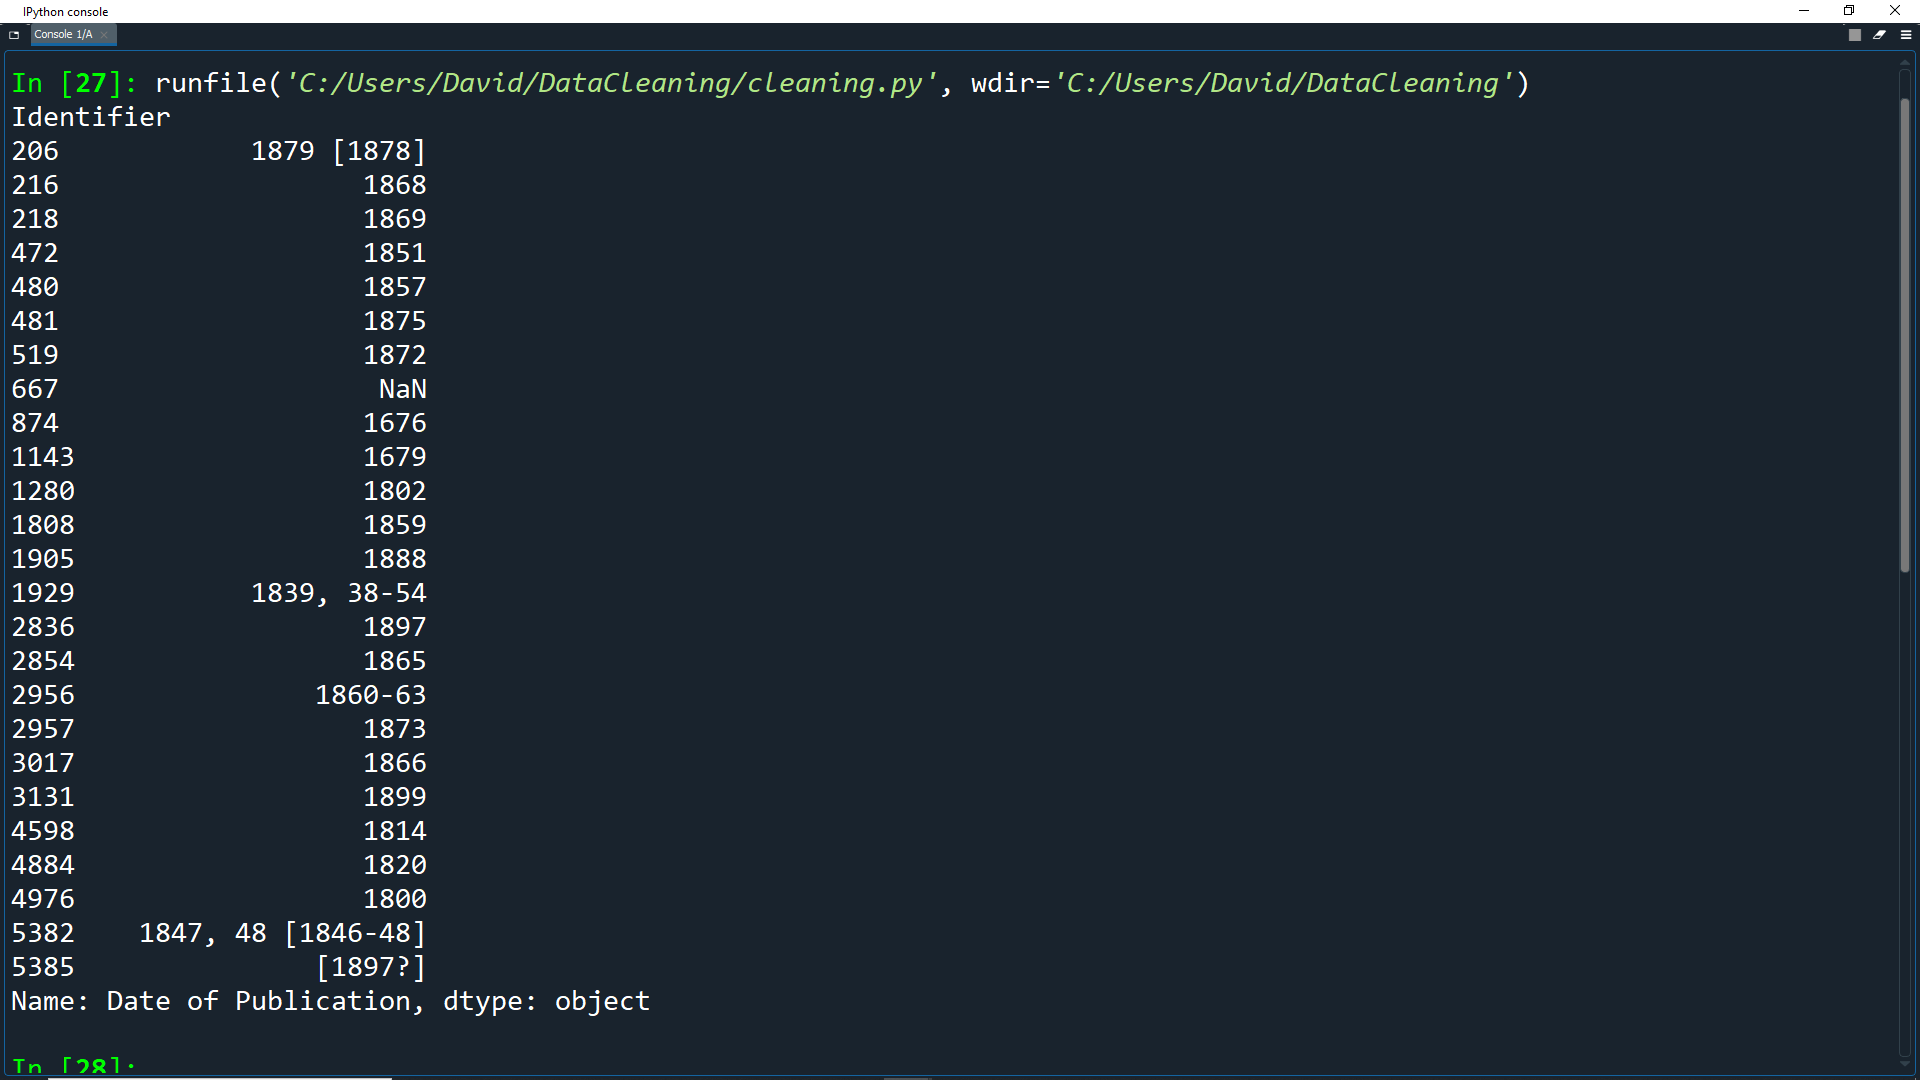
As you can see, there are a things in the data that stop it from being pure numerical data.
Here is how we will fix the data:
1. Remove the extra dates in square brackets e.g. 1879 [1878].
2. Convert data ranges to their
start dateeg. 1839, 38-54; 1860-63.
3. Completely remove dates we are not cerain about and replace them with NumPy's NaN (Not a Number) e.g. [1897?].
4. Convert the string NaN to Numpy's NaN value.
We can create a regular expression to make sure we only get the first four digits for the date.
regex = r'^(\d{4})'
A regular expression (or regex) is just a sequence of characters that forms a search pattern.
We can use the regular expression to check if a string contains the specified search pattern.
This regex finds any four digits at the begining of a string. You can see how it works here.
The \d represents any digit.
The {4} repeats this rule four times i.e. four digits.
The caret symbol ( ^ ) matches the start of a string.
The parentheses () signify a capturing group, which tells Pandas that we want to extract that part of the regex.
All of this is to make sure we get the first 4 digits of a string and ignore cases where [ starts off the string.
You can learn more about regular expressions here.
Now we can use the str.extract() method to extract the data that matches the regular expression.
regex = r'^(\d{4})'

extr = df['Date of Publication'].str.extract(regex, expand=False)
print(extr.head(25))
Note that we can also just write the regular expression directly into the method without needing a variable:
extr = df['Date of Publication'].str.extract(r'^(\d{4})', expand=False)
print(extr.head(25))
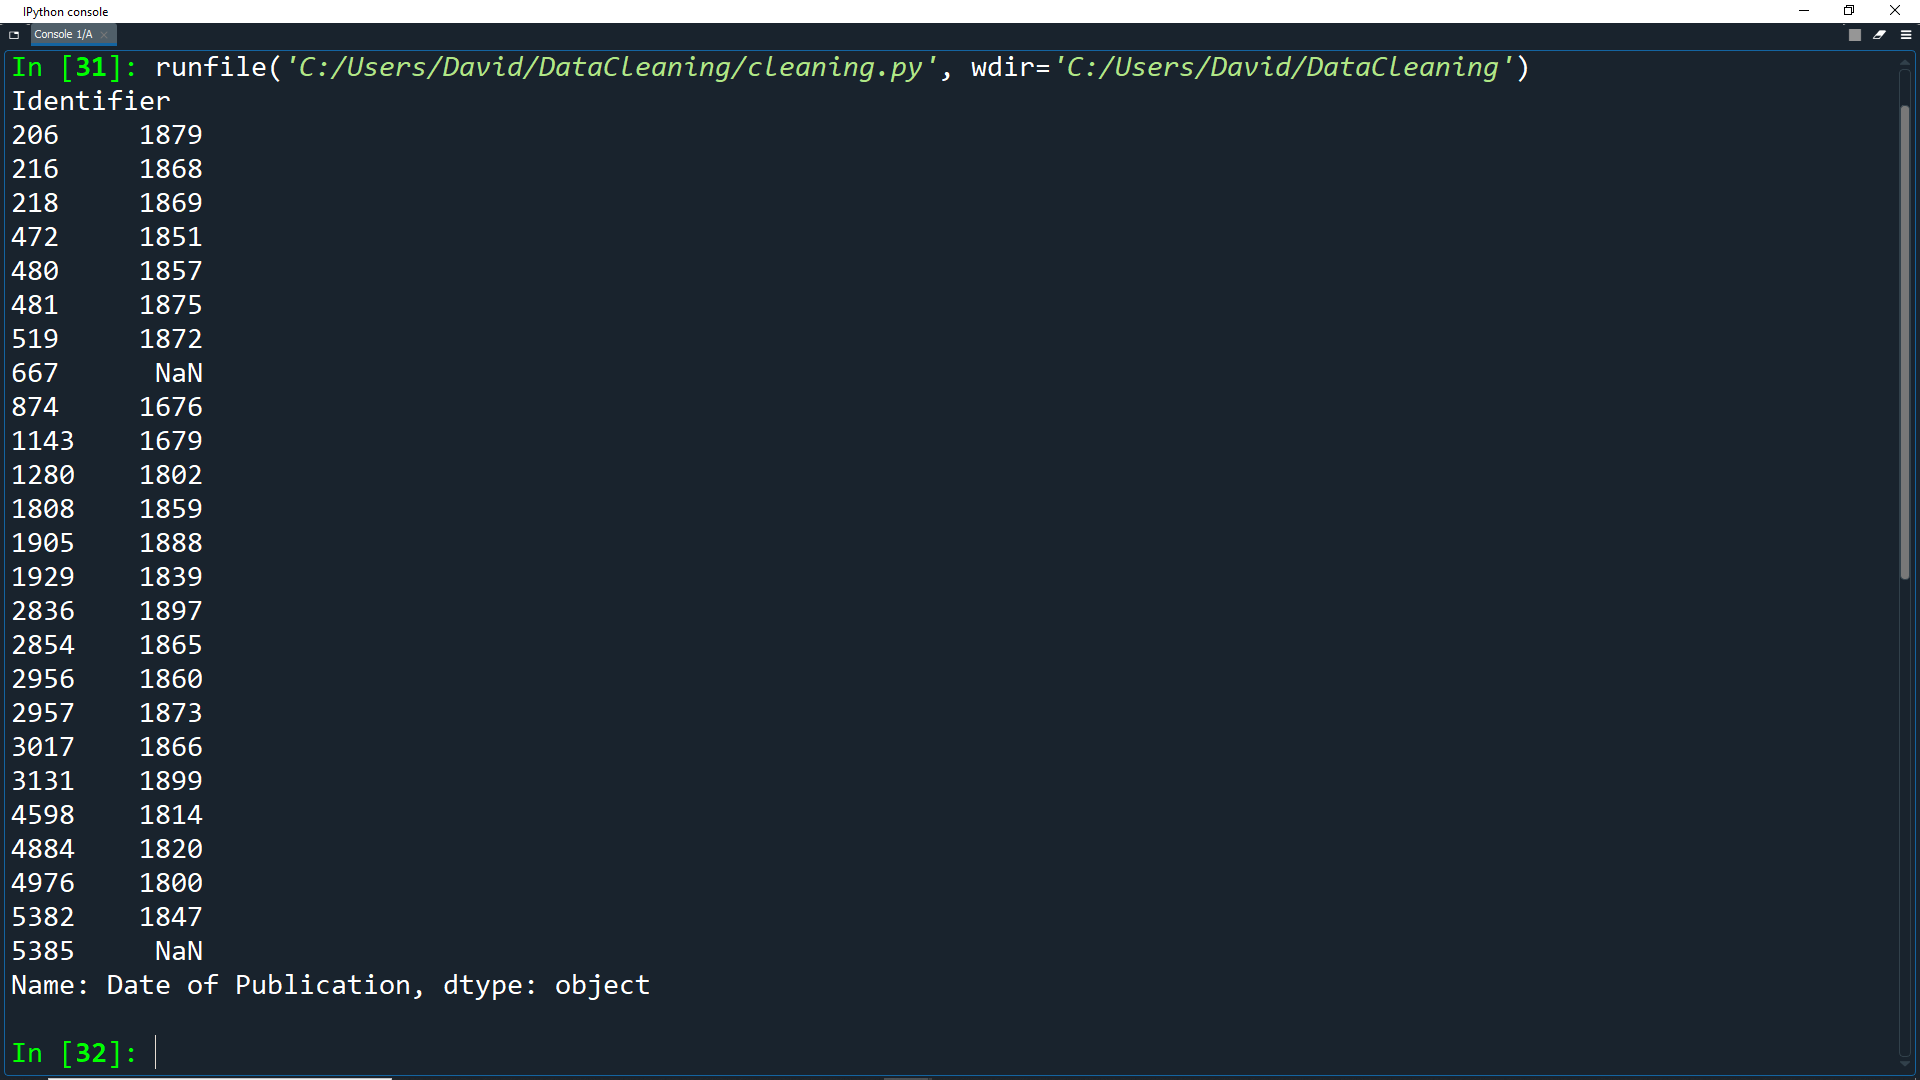
As you can see, we now only have a single date for each record. Anything without a 4 digit number will have a value of NaN.
You can also see that the dtype is still
object, but we can get the numerical version using pd.to_numeric().
extr = df['Date of Publication'].str.extract(r'^(\d{4})', expand=False)

df['Date of Publication'] = pd.to_numeric(extr)
print(df['Date of Publication'].dtype)

# Output:
# float64
Keep in mind that any date without a 4 digit number will have a value of NaN.
However it is still better to leave these values out to gain the ability to perform computations on the valid values, so we should check what percent of rows are NaN.
extr = df['Date of Publication'].str.extract(r'^(\d{4})', expand=False)

df['Date of Publication'] = pd.to_numeric(extr)

print(df['Date of Publication'].isnull().sum() / len(df))

# Output:
# 0.11717147339205986
Here we find the percentage of null values in the field by checking with .isnull() and counting with .sum().
Then we divide by the total number of records using len(df).
As you can see, about 11% of the values are missing after the extraction. Is this a high percentage of missing values? Whether this number is high or low depends on how you intend to use the data. If your major talking point for the data set was to show
As years went by, more books were published,other researchers might think that 11% is too high a missing data rate to make accurate judgments.
You could go back and try to improve the data cleanup further, attempting to capture more of the variants in dates and clean them up. However, then researchers might criticize you for making assumptions about the data that weren't accurate. You will need to decide for yourself how best to cleanup your data, and be ready to explain your cleanup methods to anyone who asks you about them later.
Fixing Strings
As you saw before with df['Date of Publication'].str, we can use the .str attribute to access string operations in Pandas.
These are similar to the native Python string operations such as .split(), .replace(), and .capitalize().
To clean the Place of Publication field, we can use Pandas .str methods with NumPy's np.where function. We will use .str to check the contents of strings, and np.where to replace strings with ones that are cleaned.
Let's take a look at the Place of Publication field.
print(df['Place of Publication'].head(10))
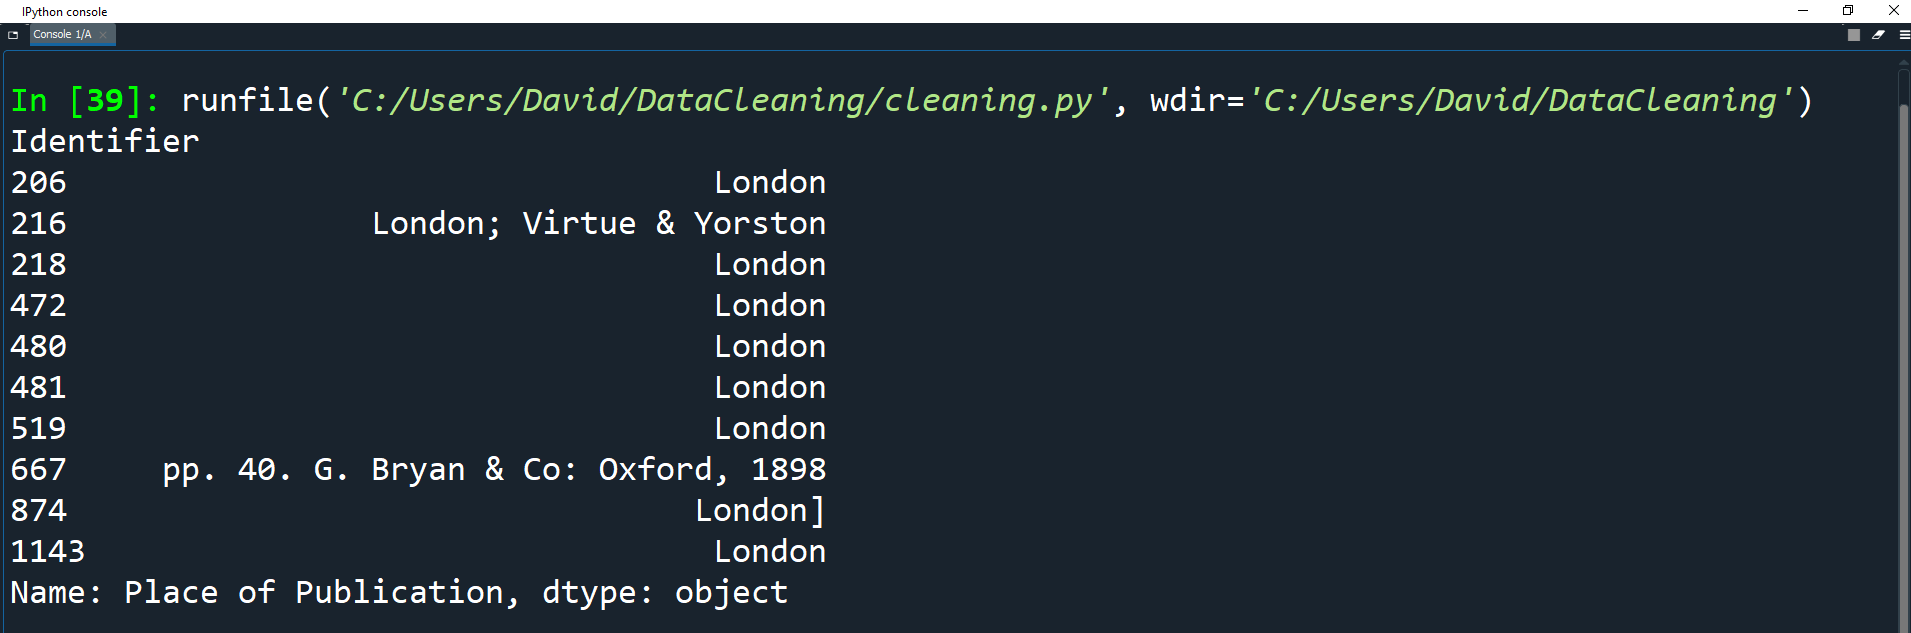
As you can see, similar to 'Date of Publication', we have some information included that we don't need.
We just want to keep a single name of the location.
Take a look a these two specific entries:
print(df.loc[4157862])
print(df.loc[4159587])
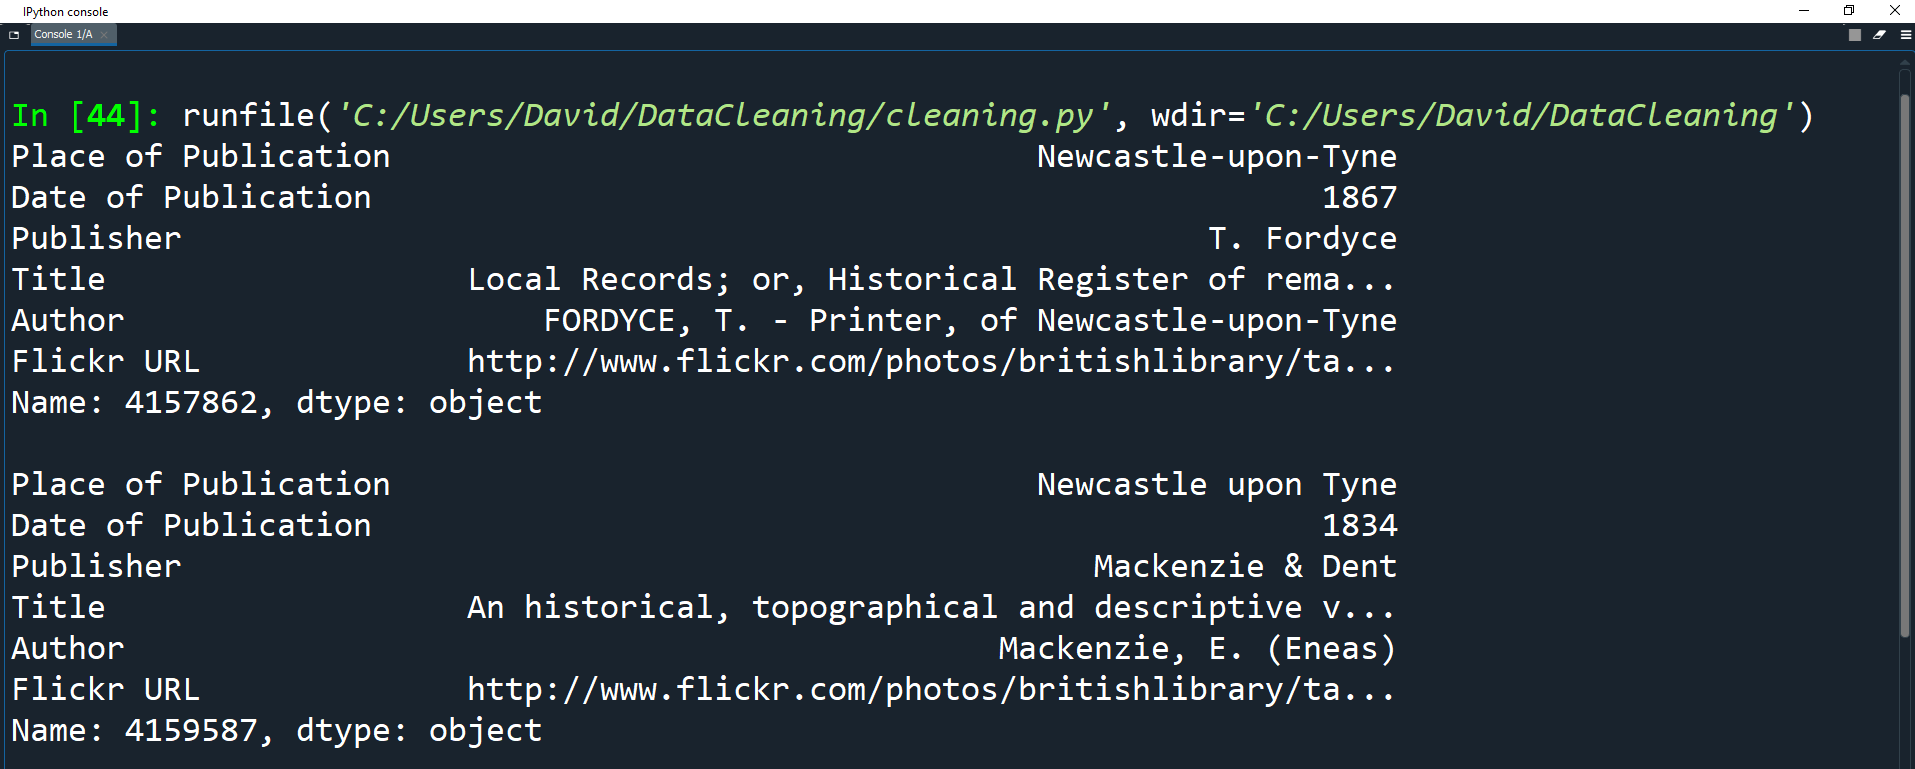
Both books were published in the same place, but one uses hyphens in the name while the other does not.
We can clean this column all at once using str.contains() to get a boolean mask.
pub = df['Place of Publication']
london = pub.str.contains('London')
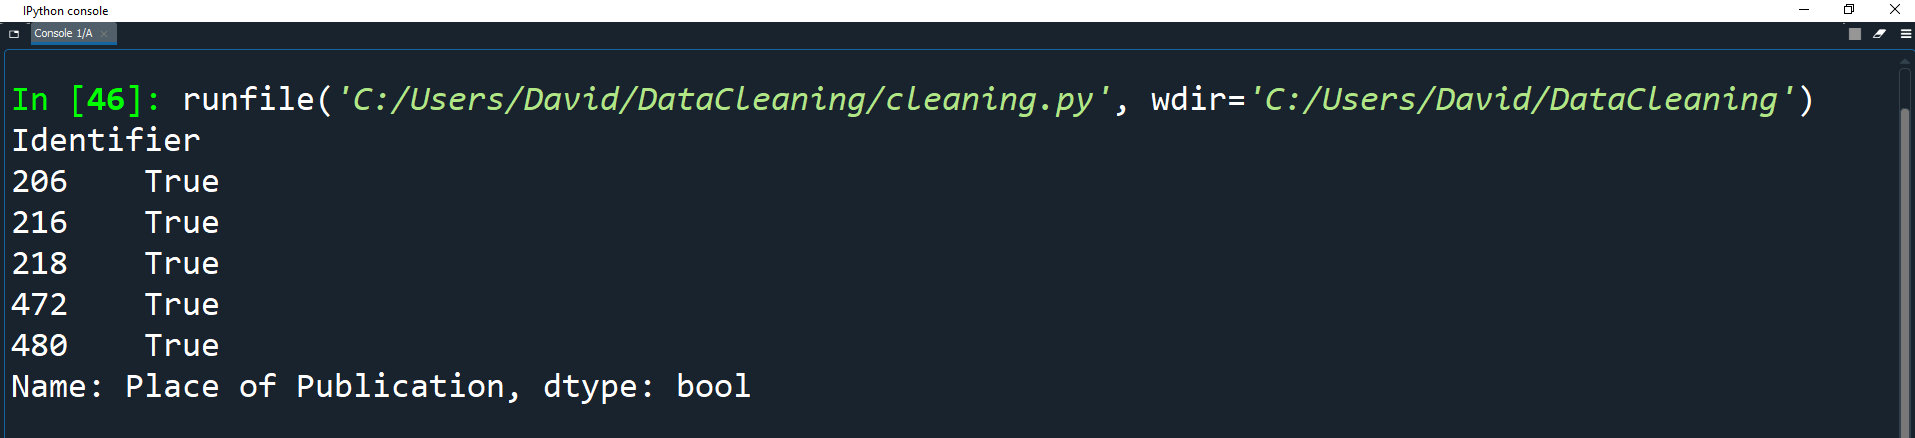
print(london[:5])
Here we create a variable for the 'Place of Publication' field called pub.
We then create a Series of all the records in pub that contain the string London.
The print statement uses list slicing to get the first 5 elements of the list.
Now create a Series of all the records in pub containing the word Oxford.
pub = df['Place of Publication']

london = pub.str.contains('London')

oxford = pub.str.contains('Oxford')
We can then use np.where() to combine the conditions.
np.where is basically an if statement for data and it has the following syntax:
np.where(condition, then, else)
condition - an array-like object or a boolean mask.
then - the value to be used if the condition evaluates to True.
else - the value to be used if the condition evaluates to False.
We can also nest the np.where() functions in order to check multiple conditions.
then - the value to be used if the condition evaluates to True.
else - the value to be used if the condition evaluates to False.
We can also nest the np.where() functions in order to check multiple conditions.
np.where(condition1, x1,
        np.where(condition2, x2,
            np.where(condition3, x3, ...)))
oxford = pub.str.contains('Oxford')

df['Place of Publication'] = np.where(london, 'London',
                                      np.where(oxford, 'Oxford',
                                               pub.str.replace('-', ' ')))
The first use of np.where() uses the london Series to check whether the string contains the word London.
If it does, then the string is set to London. If this evaluates to false, then the next use of np.where() does the same thing, but with Oxford.
Finally, if the last np.where() condition evaluates to false, then by default it will find any hyphens in the strings and replace them with a space using str.replace('-', ' ')
This is an example of functional programming when performing data cleanup. You could perform these three actions by changing the value of the Place of Publication series three times, but in this case the code uses nested functions to accomplish the same goal.
df['Place of Publication'] = np.where(london, 'London',
np.where(oxford, 'Oxford',
pub.str.replace('-', ' ')))
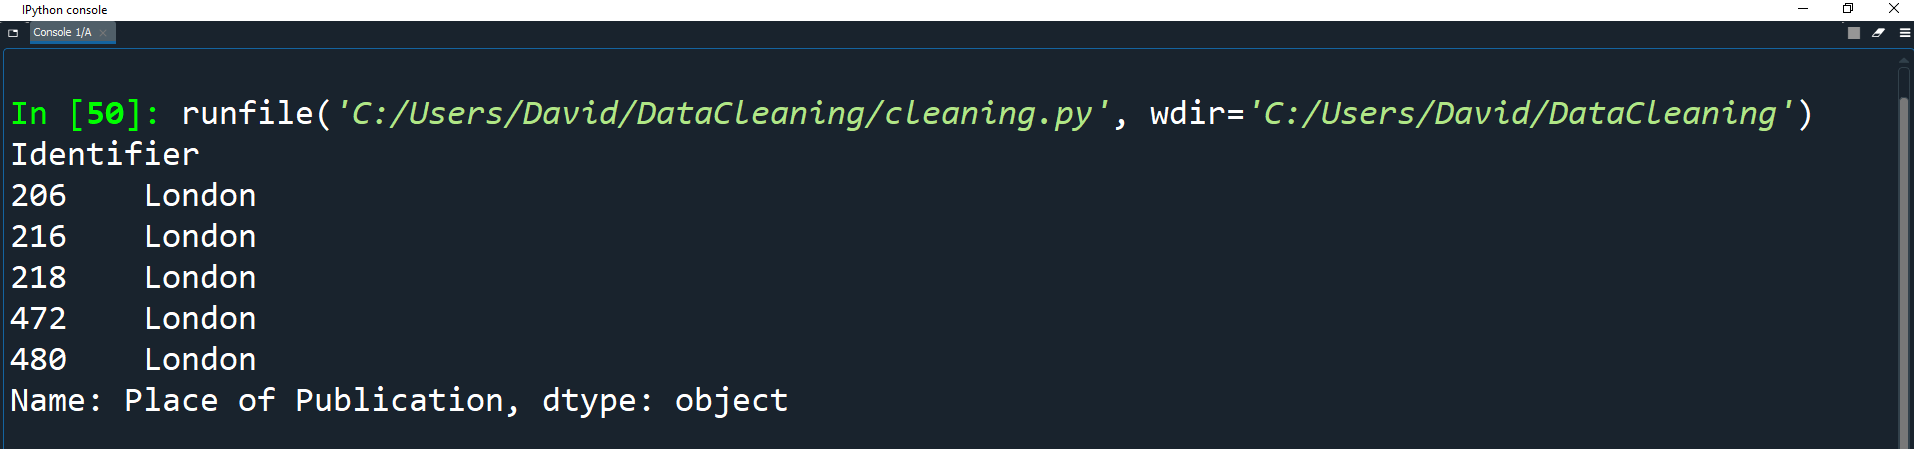
print(df['Place of Publication'].head())
Print the head of the field to see the results.
There are still other columns that could use cleaning, but the two we have cleaned already are a good start.
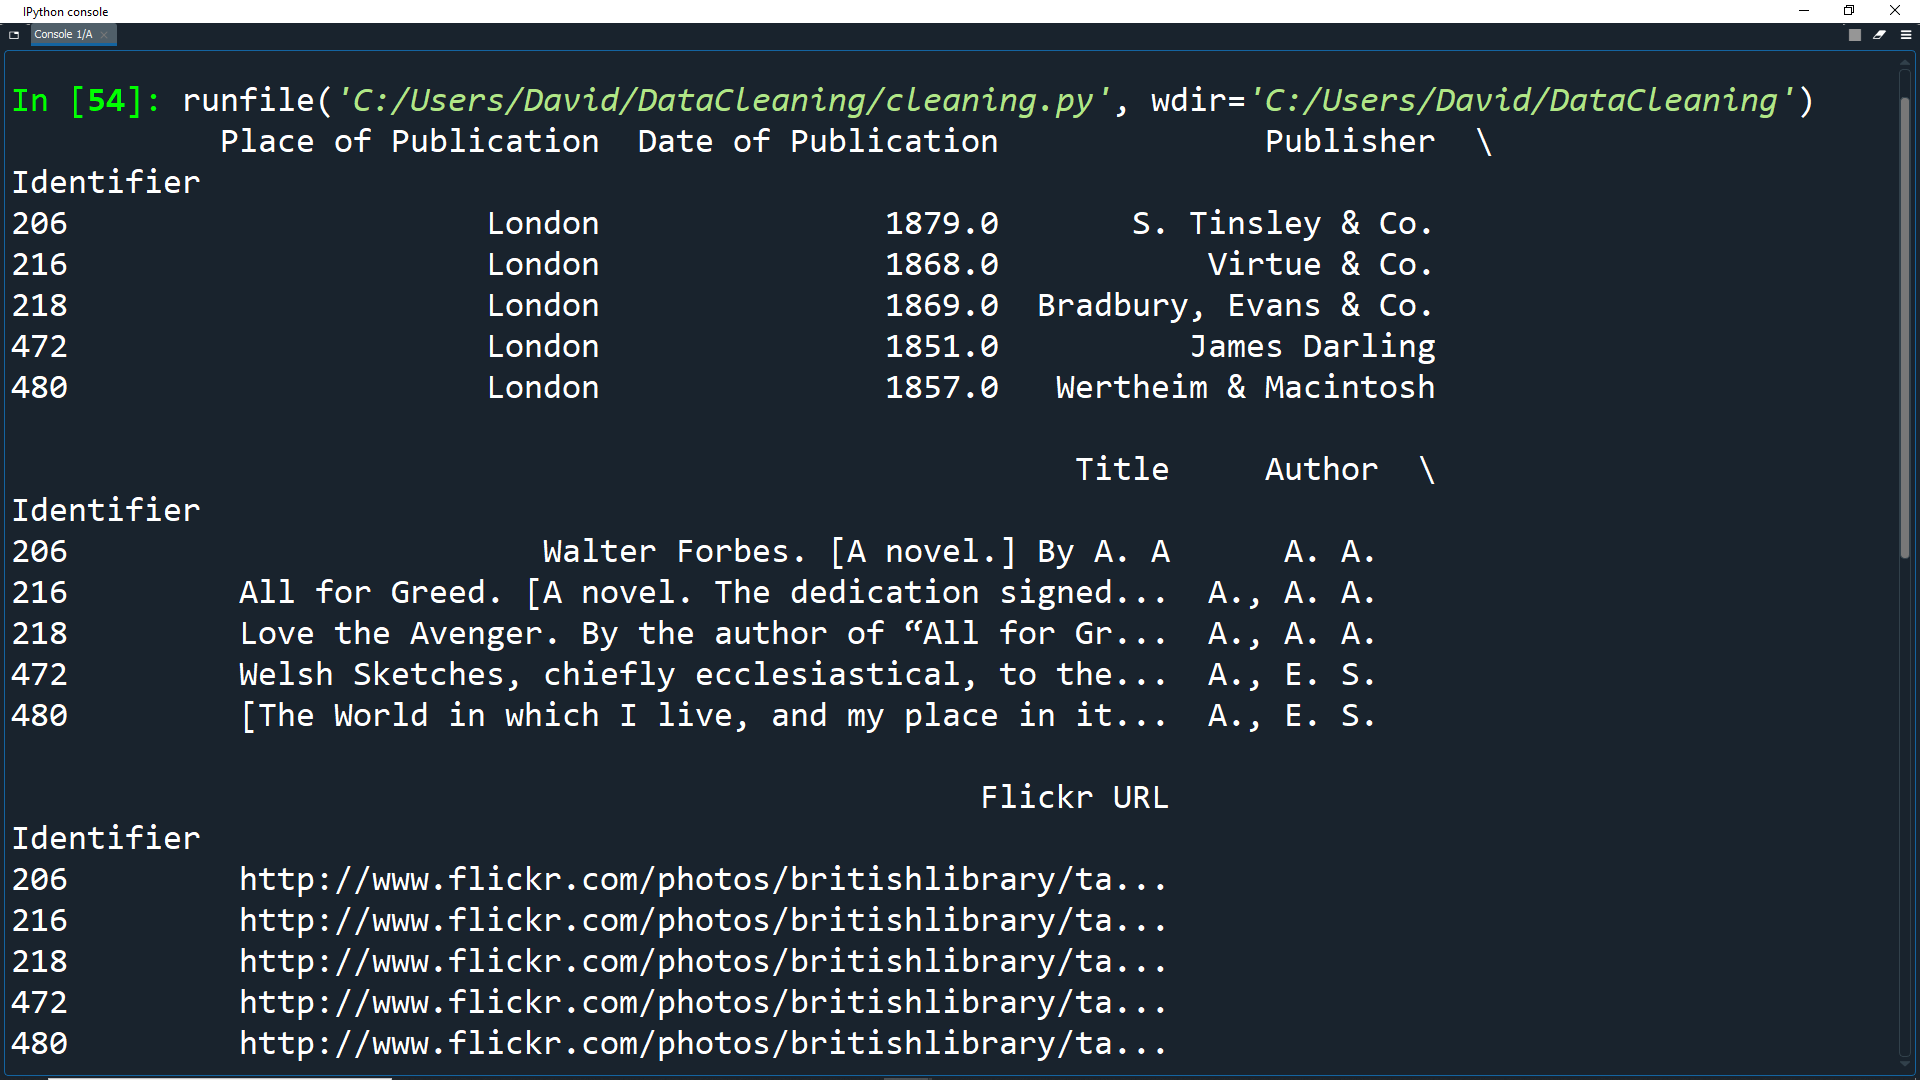
Let's look at the first 5 entries to see how our dataset looks now.
df['Place of Publication'] = np.where(london, 'London',
                                      np.where(oxford, 'Oxford',
                                               pub.str.replace('-', ' ')))

print(df.head())
Cleaning All At Once
Sometimes we don't just want to clean columns one by one. Instead we will want to apply the same cleaning functionality to all elements in the dataset.
This can be done using Pandas .applymap() function.
This function is similar to the regular Python map() function as it takes in a function and applies it to all elements in a set (in our case, a dataset).
Let's look at the university_towns.txt file. Double click on it in your Datasets folder to open it.
As you can see, the text file has periodic state names, each followed by university towns in that state in the format StateA TownA1 TownA2 ... StateB TownB1 TownB2... I.e. Alabama Auburn (Auburn University) Florence (University of North Alabama) ... Alaska Fairbanks (University of Alaska Fairbanks)...
You may also notice that each state (e.g. Alabama, Alaska, etc.) in the file has the
[edit]string at the end.
We can use this pattern to create a list of (state, city) tuples and use that list to create a DataFrame.
Close the text file, go back to your cleaning.py file and write the following code.
university_towns = []

# Open the text file and read each line
with open('Datasets/university_towns.txt') as file:
    for line in file:
        if '[edit]' in line:
            # Store this state until another one is found
            state = line
        else:
            # Otherwise, we have a city so create a tuple with the stored state and this city.
            # Then store the tuple in the university_towns list
            university_towns.append((state, line))
Here we read in the university_towns.txt file, and we loop through each line.
We then create a list of tuples, each containing a state and a city.
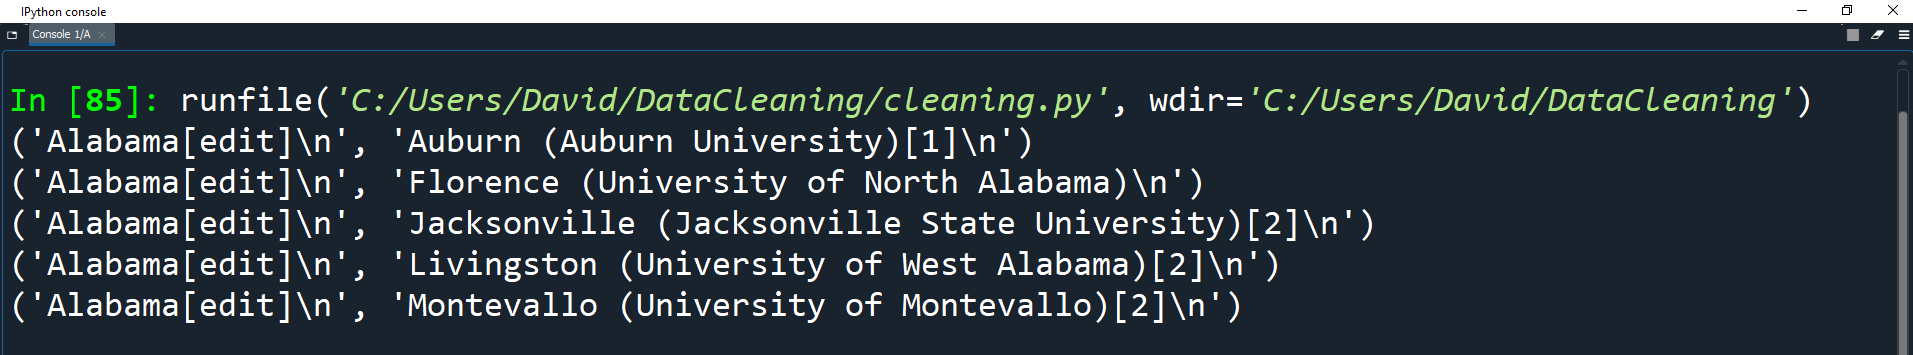
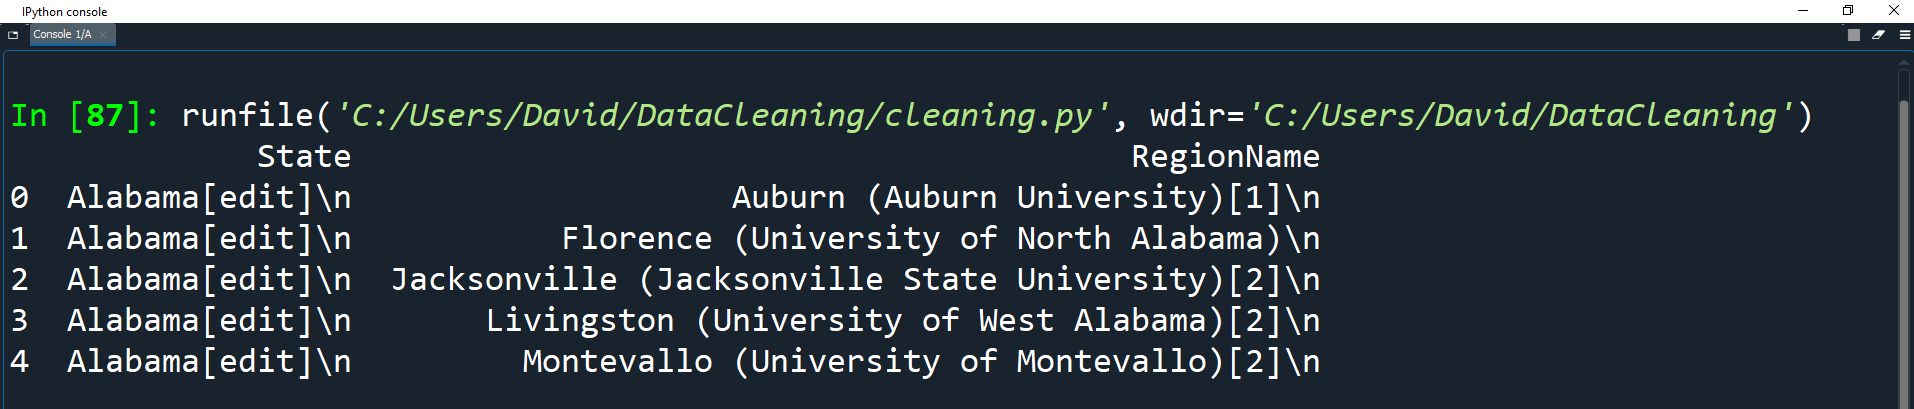
Print the first 5 elements of the list to see what the tuples look like.
university_towns = []

# Open the text file and read each line
with open('Datasets/university_towns.txt') as file:
    for line in file:
        if '[edit]' in line:
            # Store this state until another one is found
            state = line
        else:
            # Otherwise, we have a city so create a tuple with the stored state and this city.
            # Then store the tuple in the university_towns list
            university_towns.append((state, line))

for x in range(5):
    print(university_towns[x])
We can now use this list of tuples to create a DataFrame and set the columns as State and RegionName.
towns_df = pd.DataFrame(university_towns, columns=['State', 'RegionName'])

print(towns_df.head())
Now we have a DataFrame, we can use applymap() to clean each element.
First we have to create a function that will be applied to the elements.
towns_df = pd.DataFrame(university_towns, columns=['State', 'RegionName'])

def get_citystate(item):
    if ' (' in item:
        return item[:item.find(' (')]
    elif '[' in item:
        return item[:item.find('[')]
    else:
        return item
Here define a function called get_citystate which takes in one object (this will be the DataFrame element).
We then check if the item contains ' (' or contains '['. If it does, we use splicing to return only the part of the element up to the brackets.
If it does not contain any brackets, then we just return the item as it is.
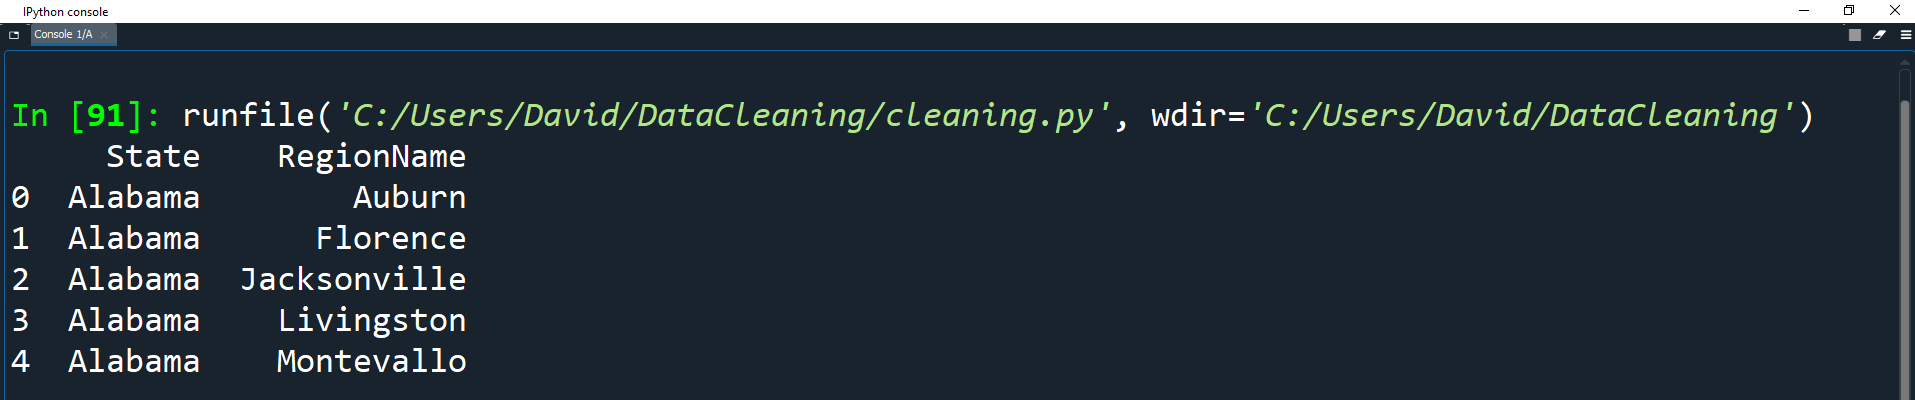
Now let's apply this function to the DataFrame with applymap()
def get_citystate(item):
    if ' (' in item:
        return item[:item.find(' (')]
    elif '[' in item:
        return item[:item.find('[')]
    else:
        return item

towns_df = towns_df.applymap(get_citystate)

print(towns_df.head())
Renaming Columns and Skipping Rows
Sometimes when we get a dataset, the column names are not easy to use/understand or some of the rows will have unimportant information.
In these cases, we may want to rename columns and skip some rows.
Let's take a look at the olympics.csv dataset as an example.
olympics_df = pd.read_csv('Datasets/olympics.csv')

print(olympics_df.head())
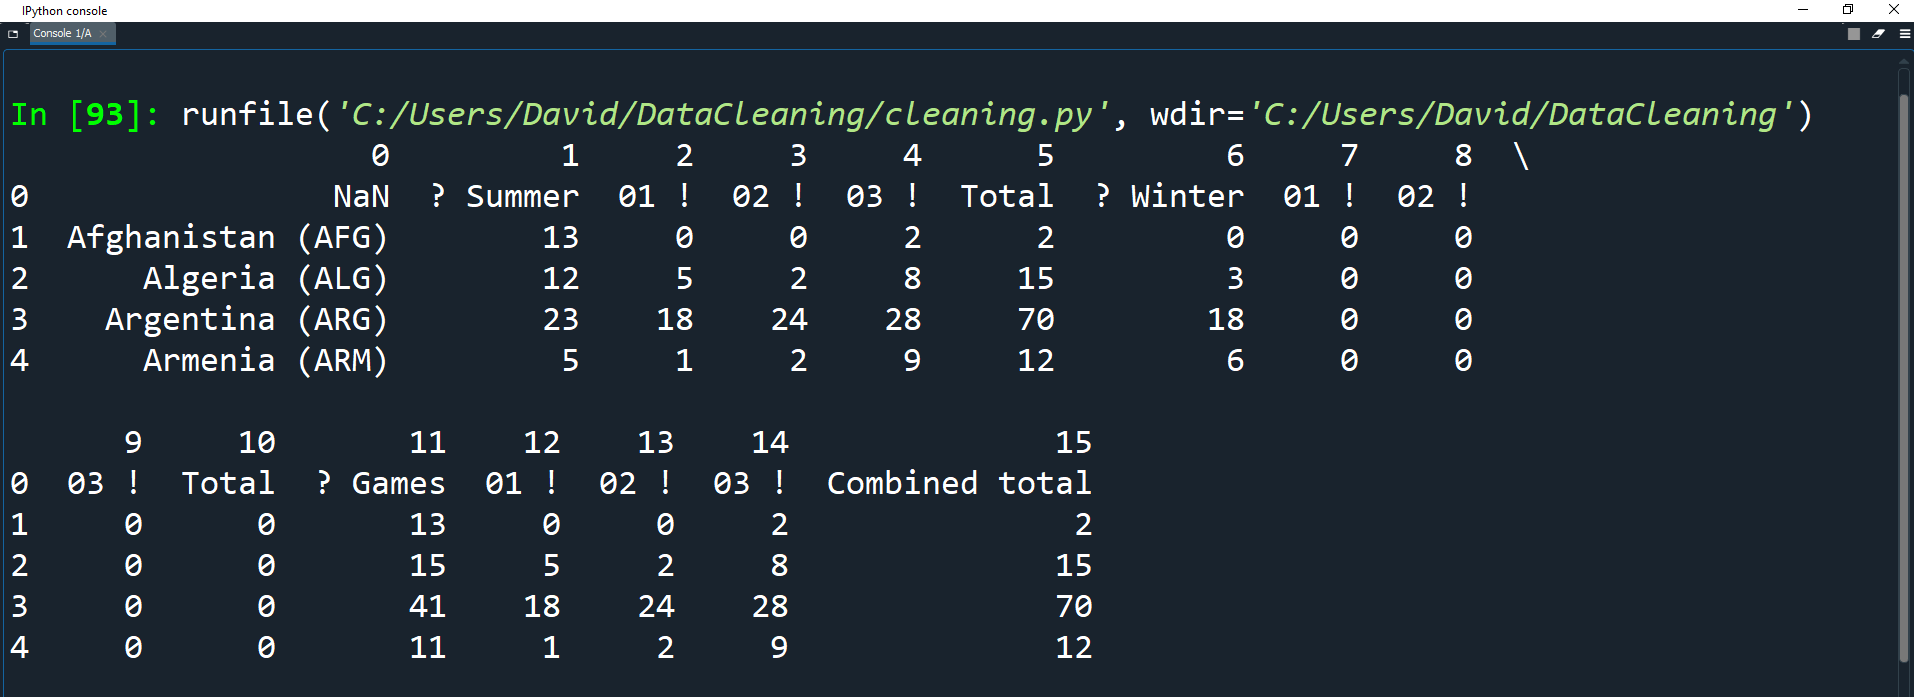
As you can see, the above data doesn't look very clean for the following reasons:
The column headers are string forms of numbers starting at 0.
The row which should be the header is instead the first row in the dataset records.
You can look at the source data here and you will notice that the row which should be the header has bad values.
For example NaN should really be
Country,
? Summershould be
Summer Gamesand
01 !should be
Goldetc.
We need to fix these problems by:
1. Skipping one row and setting the header as the first row.
2. Rename the columns
We can skip rows and set the header when reading the CSV file by setting the header parameter.
Let's take a look at the olympics.csv dataset as an example.
olympics_df = pd.read_csv('Datasets/olympics.csv', header=1)

print(olympics_df.head())
This removes the first row and sets the header row to index 1.
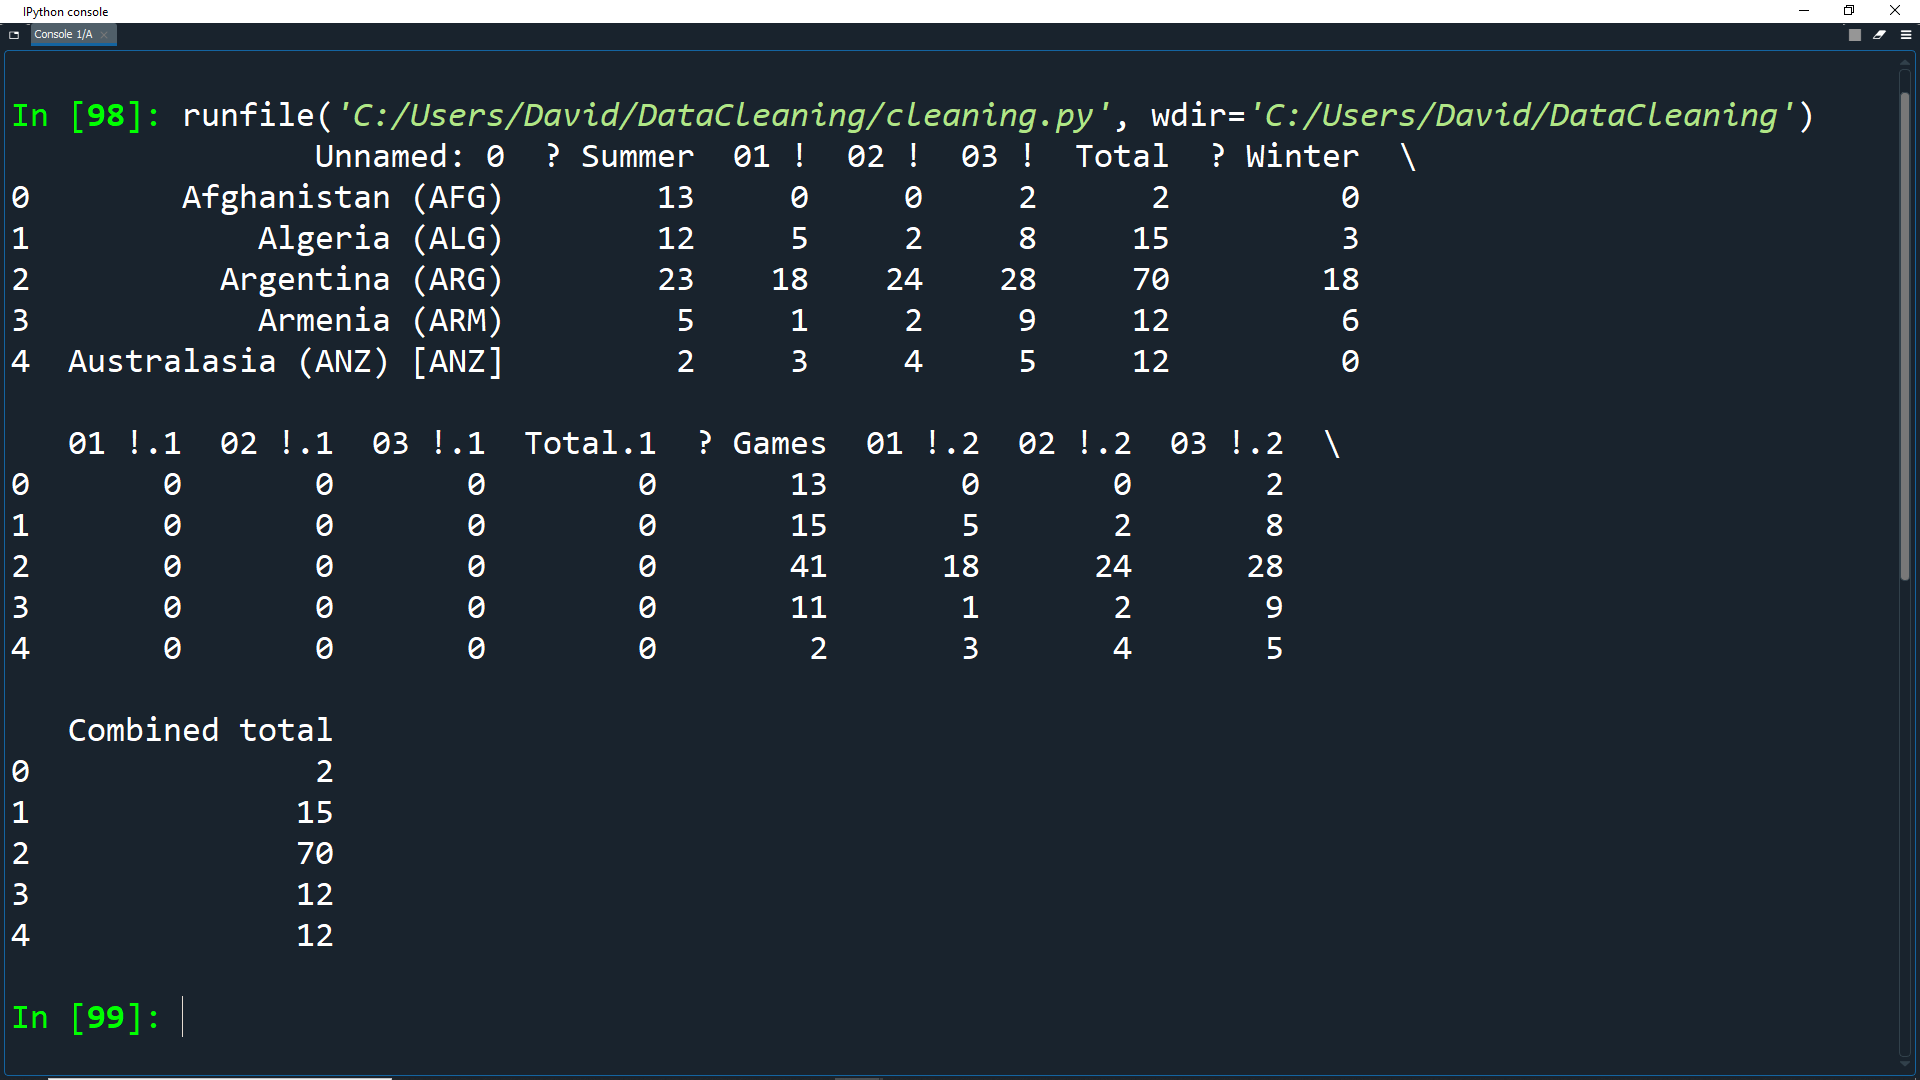
Note that Pandas has changed the name of the column containing the countries from NaN to Unnamed: 0.
Next we need to rename the columns. We can do this using the rename() method.
We can use this to relabel an axis by mapping the original values to new values. We will use a dictionary for this.
olympics_df = pd.read_csv('Datasets/olympics.csv', header=1)

new_names =  {'Unnamed: 0': 'Country',
             '? Summer': 'Summer Olympics',
             '01 !': 'Gold',
             '02 !': 'Silver',
             '03 !': 'Bronze',
             '? Winter': 'Winter Olympics',
             '01 !.1': 'Gold.1',
             '02 !.1': 'Silver.1',
             '03 !.1': 'Bronze.1',
             '? Games': '# Games',
             '01 !.2': 'Gold.2',
             '02 !.2': 'Silver.2',
             '03 !.2': 'Bronze.2'}
Here we create a dictionary called new_names.
Each item in the dictionary has a key and a value: the key is the current column name and the value is the new name.
Now we can call the rename() function on the dataframe using the dictionary.
olympics_df.rename(columns=new_names, inplace=True)

print(olympics_df.head())
As mentioned before, we can use set the inplace parameter to True so that our changes are made directly to the dataframe object.
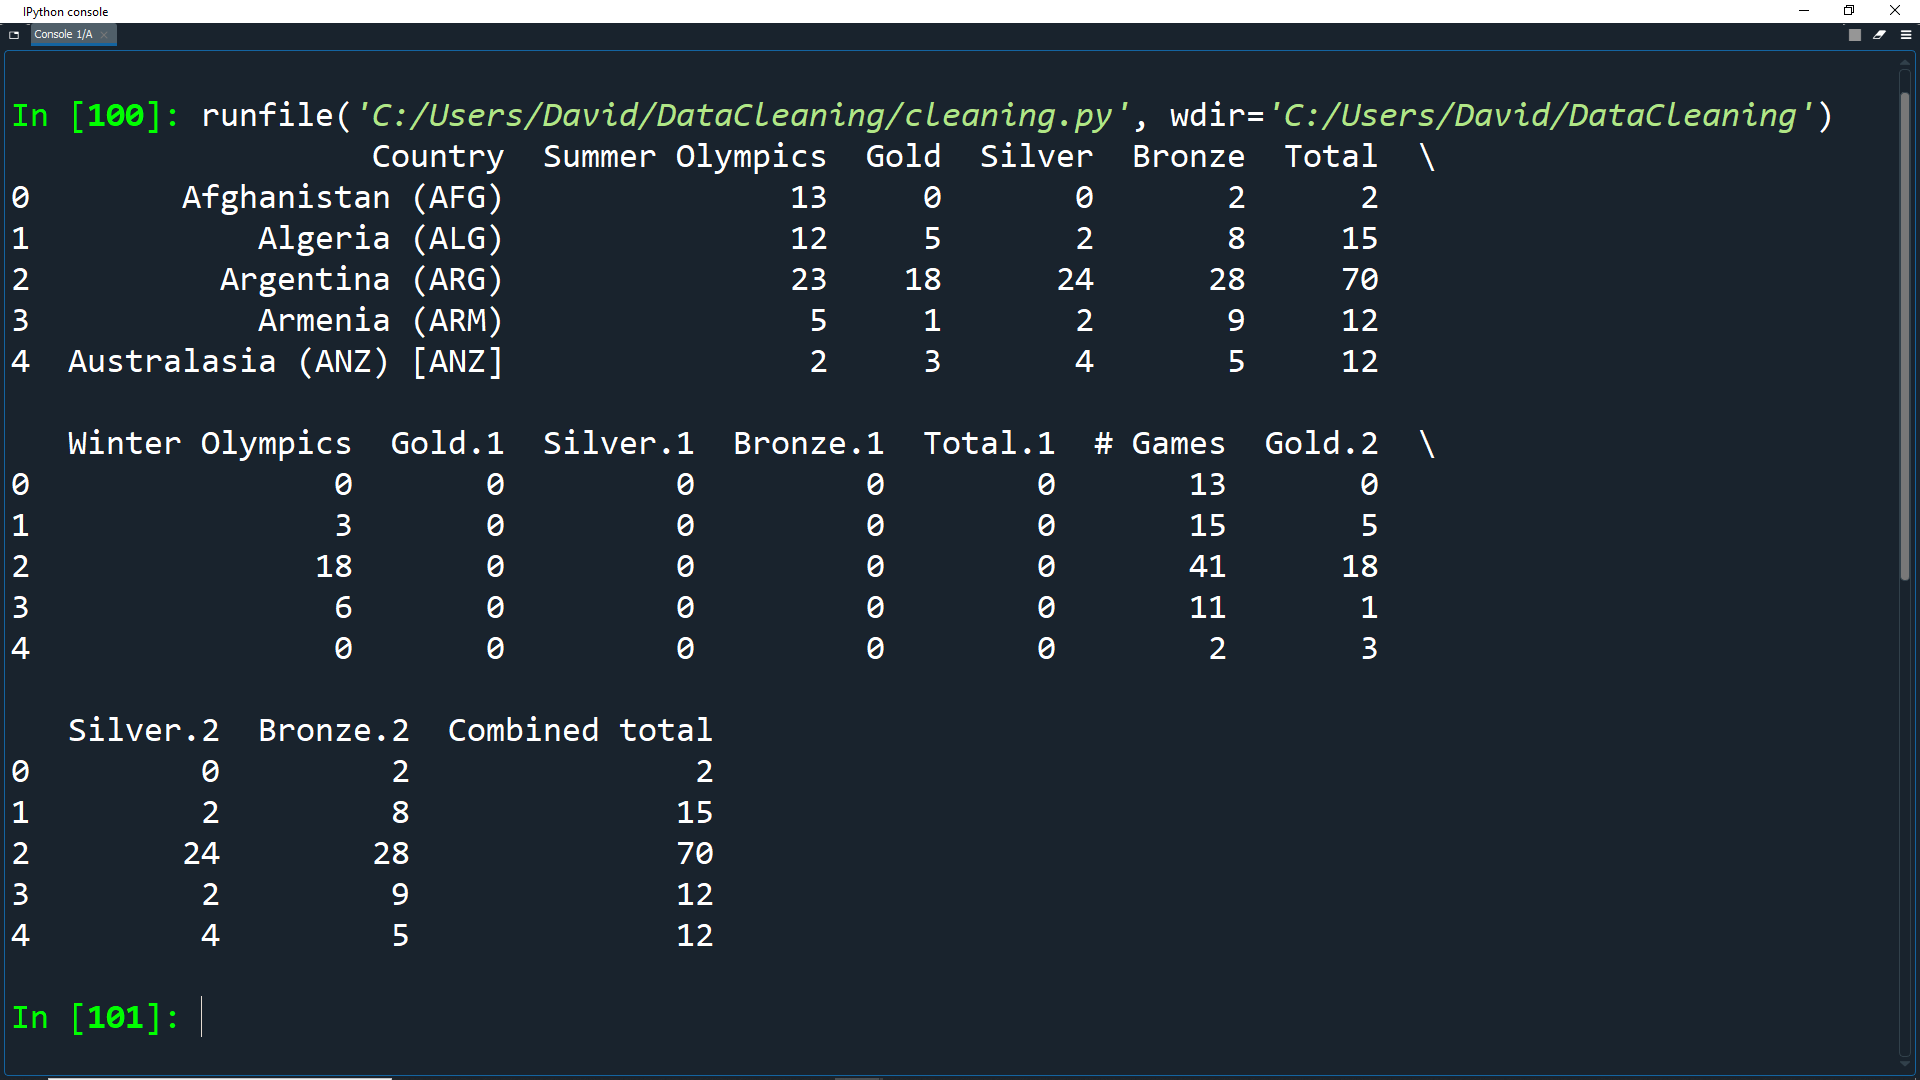
Perfect! Our dataset now has good, understandable headers for each column.
Activity: Data Cleaning
- What do you want to learn from the dataset?
- What columns will you need to include? What columns can you remove?
- Do all the fields have valid data? Do any rows with incomplete data need to be removed?
In the last lesson, there was an activity to find other interesting datasets online.
Based on what you learned in this lesson, download one of the datasets you found and try to clean up the data using the techniques you've learned.
Think about the following questions when cleaning up the data:
As you write your cleanup code, make sure to add comments to the code to explain why you are performing specific cleanup actions. If you are trying to use your code to persuade someone, they might want to look at how you cleaned up the data before you presented your ideas to them.