Dataframes with Pandas
In this lesson, you will learn about the Pandas python module (short for Panel Data
) that will let us visualize data inside of python.
Dataframes
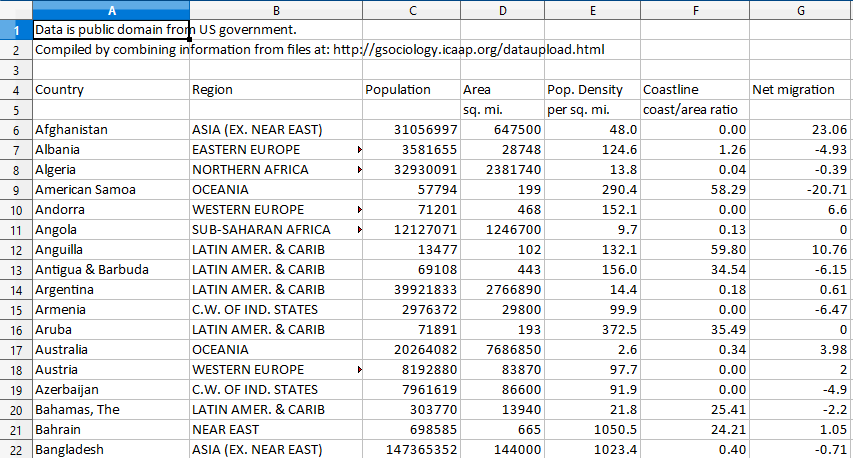
You might have used a spreadsheet program like
Excelin the past to organize data. Data in those programs is organized into rows and columns, so that you can easily find the information that you're looking for. In the spreadsheet below, each of the rows is a different country, and each of the columns has different information about that country.
Pandas works in a similar way. Data is organized into columns and rows so that it is easy to understand, called a Dataframe.
In the previous lesson you learned about numpy arrays, which can be laid out like these spreadsheets as well. But a pandas dataframe object includes not only raw numbers, but also metadata related to the numbers. For example, a numpy array will have a group of numbers laid out in a grid, but a dataframe will include information like the titles of columns of that data.
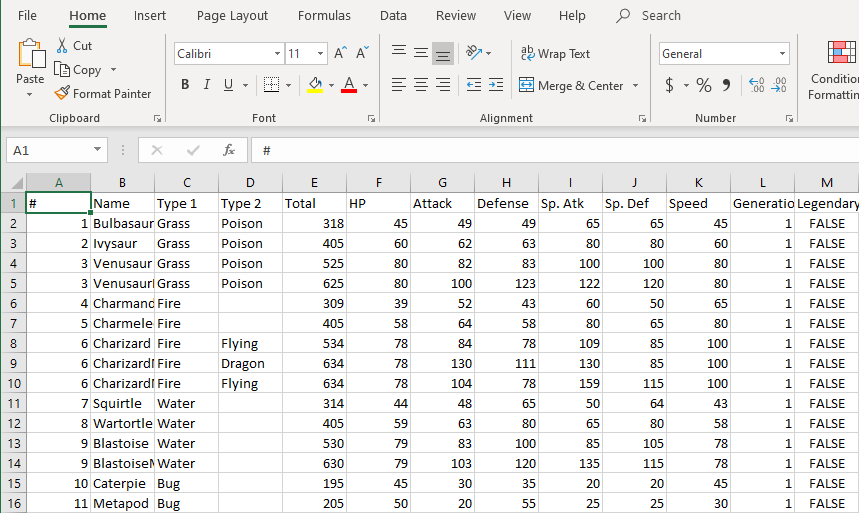
For this lesson, we're going to be working with a data set of Pokémon. Pokémon are a type of creature that appears in the Pokémon video games. (Wikipedia Entry) Each Pokémon has specific powers that players use to battle other players, called
pokémon trainers.
Create a new file called
pokemon.py, and import the pandas module at the top of the file.
import pandas as pd
Here we use import as to abbreviate the pandas namespace to pd.
Next, we'll learn how to import data into a dataframe in python.
Importing CSVs
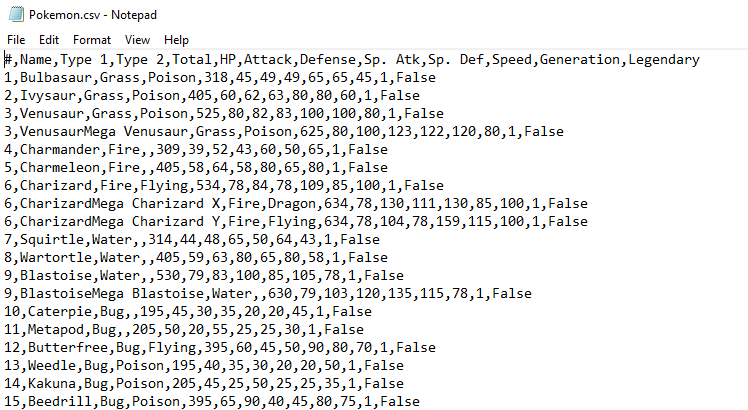
Download the CSV (Comma-separated Values) file here: Pokemon.csv
Make sure you save the file in the same location as your python file.
A CSV file is a text file that is organized into rows and columns. The separation between columns is indicated by a comma, and the separation between rows is indicated by a newline.
You can open up the .csv file in a spreadsheet program or a text editor and look at the data by hand if you want to. However, we'll be using the pandas module to manipulate the data through a dataframe.
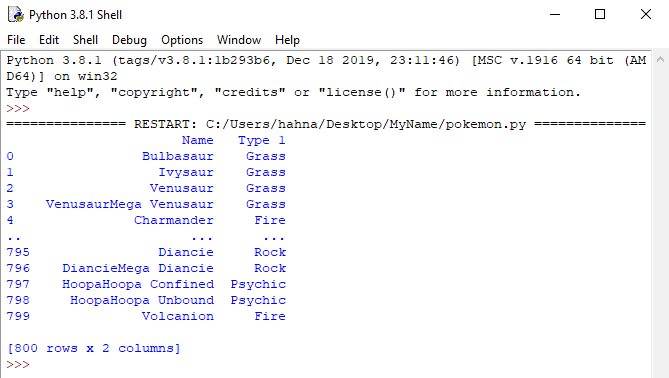
We'll start by reading in the information in Pokemon.csv by using pandas' read_csv() function. This function returns a dataframe, so we'll store it in a variable and print it out to see what the dataframe includes.
import pandas as pd

poke = pd.read_csv('Pokemon.csv')
print(poke)
By printing out the dataframe, we're given a couple key pieces of information.
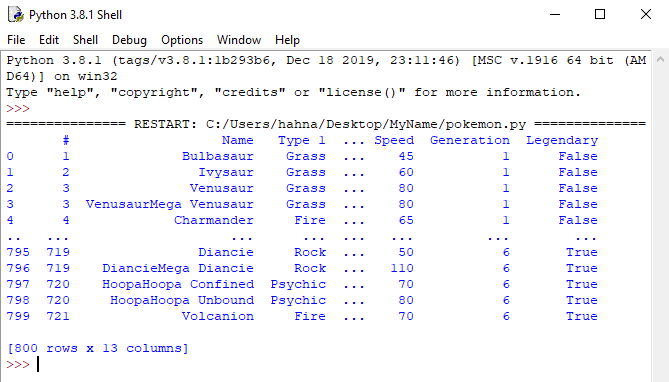
The top row shows the Column Names. We'll use these to reference individual columns when we want to see that information.
You'll notice the first column of the result does not have a name. This column is called the index. This is the row number of the dataframe. The index is important for the dataframe, since it improves the speed at which python can find information inside the dataframe.
At the bottom of the file, you see the total number of rows and columns that were present in the CSV file we read. For this file, it was 800 rows and 13 columns. This is called the Shape of the data.
After the 4th column and the 5th row, there are three dots ..., and then you see three more columns, and 5 more rows! But shouldn't our file have 800 rows? Where did they go? Well, pandas knows that printing out the ENTIRE data set might make things hard to read, so it tries to give us a simpler way to view the data by only showing us a limited set.
There are other ways to view data as well:
1. The head() function will show rows of data starting from the top of the dataframe. You can add a number as an argument to the function to see a specific number of rows, otherwise it will show you the top 5 rows.
2. The tail() function will show rows of data starting from the bottom of the dataframe. You can add a number as an argument to the function to see a specific number of rows, otherwise it will show you the bottom 5 rows.
After running your program, you can try running these individual lines from the interpreter and seeing the results.
print(poke)

print(poke.head())

print(poke.head(20))

print(poke.tail())

print(poke.tail(30))

print(poke.head(20))
There are other ways for us to look at this dataset as well.
1. The info() function shows us information about the entire dataframe. This is helpful to see all of the column names and what type the column is. It will also tell us how many null values the column has.
2. The describe() function tries to summarize all the columns of the table, which can be helpful for information like finding the mean (average) of all values of a column. Based on the output of the describe function, we can know that the average Speed of a pokémon is around 68.
First, try using the info() function.
import pandas as pd

poke = pd.read_csv('Pokemon.csv')

print(poke.info())
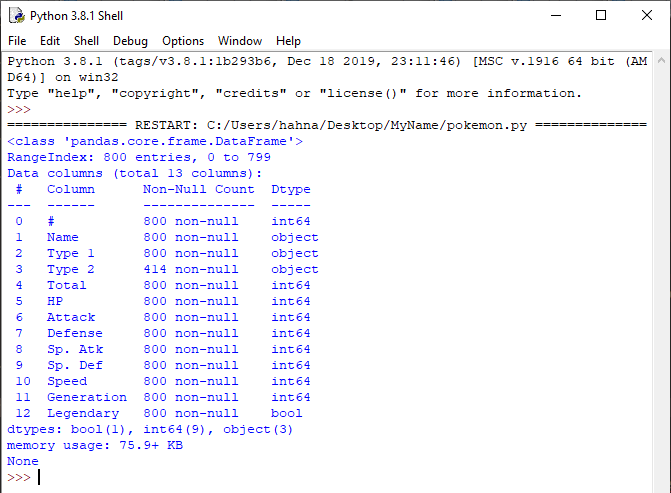
The info function is very important to use when looking at a dataframe. This section will explain each of the columns in the dataset. If you already know about pokémon, you may already understand the column names. But if you don't, make sure you read this section so that you understand the data.
1. The first column (the one at the index of 0), is the
2. In this dataframe, each pokémon's name is present in the
3. The
4. There are 6 columns related to the pokémon's individual stats, the
5. The
6. The
7. The
1. The first column (the one at the index of 0), is the
#column. This stands for the pokémon's number in the internal game list of all pokémon. Because some pokémon have multiple forms, there may be some duplicate numbers in this column.
2. In this dataframe, each pokémon's name is present in the
Namecolumn.
3. The
Type 1column shows the primary type of the pokémon, and the
Type 2column shows the secondary type. Since not all pokémon have secondary types, some of these values are blank, or null. There are 414 pokémon that have a value in the Type 2 column.
4. There are 6 columns related to the pokémon's individual stats, the
HP,
Attack,
Defense,
Sp. Atk,
Sp. Def, and
Speedcolumns. The higher these values are, the more powerful the pokémon is.
5. The
Totalcolumn is the sum of the individual stat columns for the pokémon. If the total number is higher, the pokémon's overall power and usefulness in battle will be higher.
6. The
Generationcolumn shows which version of the pokémon game they were first seen in. Based on the output of the describe function, we know that the values of this column go from 1 to 6.
7. The
Legendarycolumn is a boolean value, which means it is either True or False. If this value is True, it indicates a pokémon that is especially rare and powerful.
Next, let's try the describe() function.
import pandas as pd

poke = pd.read_csv('Pokemon.csv')

print(poke.describe())
The describe function shows different summary values for the dataframe. E.g. count, mean, min, max, etc.
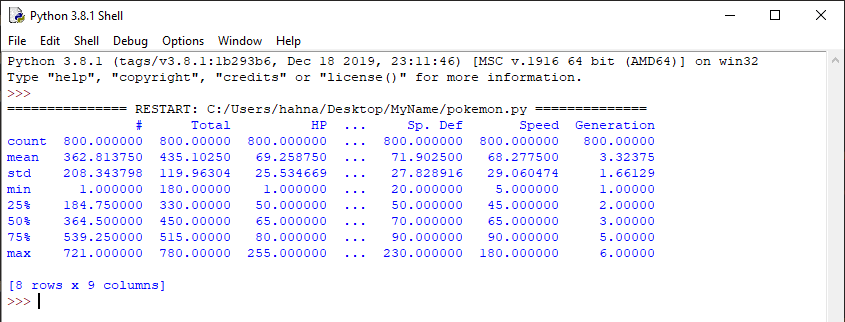
By looking at the output of describe(), we can see that the minimum Total value is 180, the maximum Total value is 780, and the mean (average) Total value is 435.10250.
These basic functions show us information about the entire dataframe, but we can use other functions to view data more specifically to find out exactly what we want to know.
Showing Specific Rows
You can view individual rows from a dataframe in the same way you get information from a dictionary.
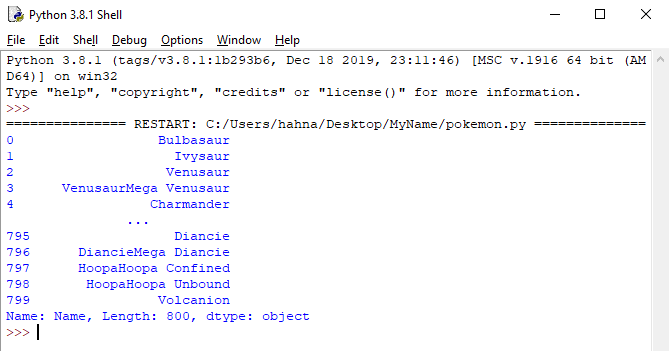
By using the dataframe name, and then putting the column name in square brackets and single quotes, you can return information from just that column.
import pandas as pd

poke = pd.read_csv('Pokemon.csv')

print(poke['Name'])
If you want to show more than 1 column at a time, you can put two square brackets around the column names and separate them with a comma.
import pandas as pd

poke = pd.read_csv('Pokemon.csv')

print(poke[['Name', 'Type 1']])
You can also find data inside a dataframe based on a condition. For example, in order to find information on the pokémon Pikachu, we can use the following code.
import pandas as pd

poke = pd.read_csv('Pokemon.csv')

print(poke[poke['Name'] == 'Pikachu'])
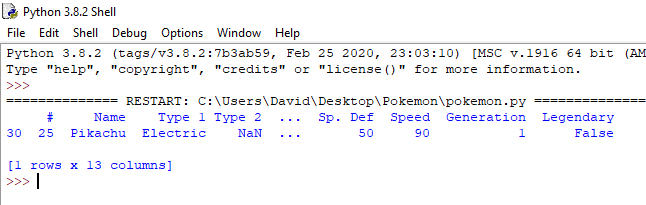
This code can be read like this:
Get all rows from the poke dataframe where the name value for the row equals Pikachu. This sound familiar? This is just the syntax that pandas uses for a filter!
The outside of the dataframe is poke[] and the condition for which rows to return is poke['Name'] == 'Pikachu'
We can also select rows inside a dataframe by checking for specific values in a column. You can type each of the below lines inside the python interpreter and see what you find out about the data set.
#Will return all rows where the 'Name' column contains the word "Mega"
print(poke[poke['Name'].str.contains('Mega')])

#You can add a '~' in front of the condition to reverse it; this will only show pokémon without "Mega" in their name
print(poke[~poke['Name'].str.contains('Mega')])

#Will return all rows where the 'Speed' column is greater than 120
print(poke[poke['Speed'] > 120])

#Will return all legendary pokémon from generation 1, use the '&' symbol between conditions to have more than one criteria for selection
print(poke[(poke['Generation'] == 1) & (poke['Legendary'] == True)])
Now that you understand the basic tools of filtering, next we'll cover how to use groups to really narrow down your data into what you want to know about the pokémon in this data set.
Data Manipulation
We're going to learn how to group, analyze and sort data.
Pandas has data aggregation functions we can use to simplify the way we see data. Aggregation functions are ways you can group the data into different categories. You can pick a column and group the rest of the rows by their values in that column.
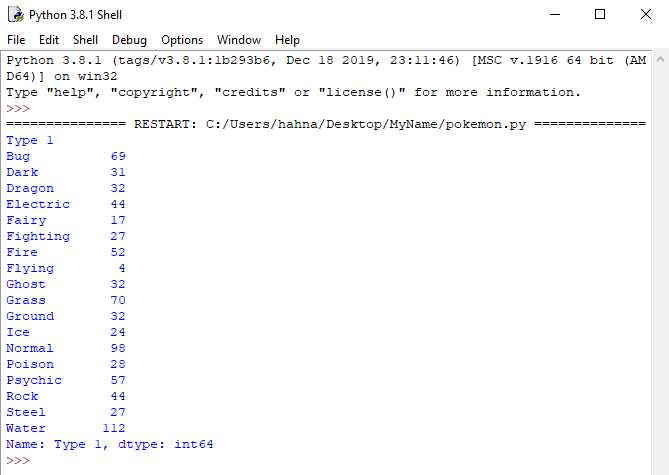
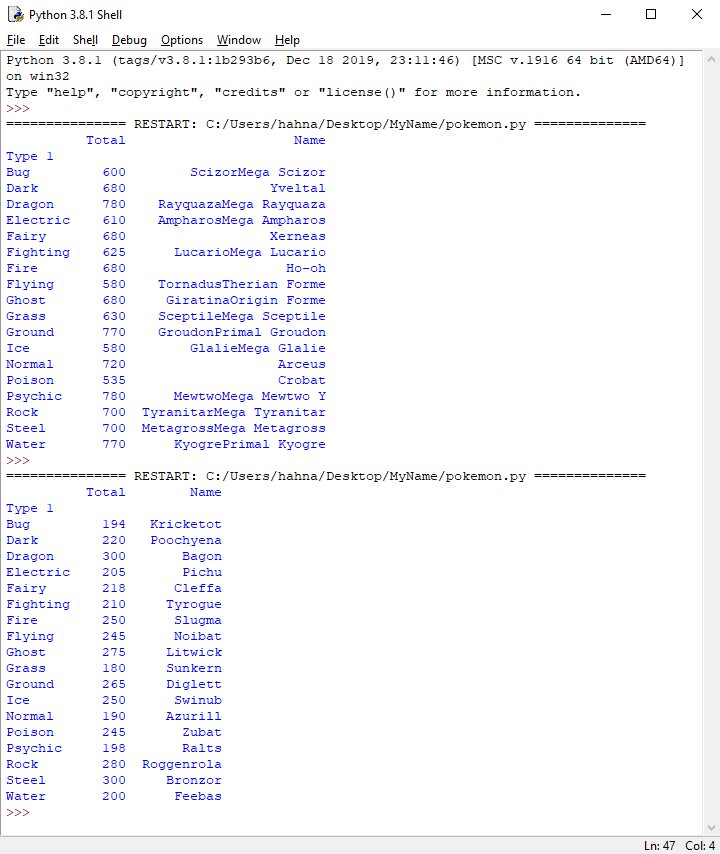
For example, how many pokémon are there of each of the different types? We can learn this by using a groupby() function, followed by a count() function. We are going to organize the information into groups based on the different Type 1 values of pokémon.
import pandas as pd

poke = pd.read_csv('Pokemon.csv')

print(poke['Type 1'].groupby(poke['Type 1']).count())
If you want to use a group by function to organize the data into groups, you must follow that function with a function that will tell you how you want to show the different groups.
Count() is a very common grouping function, because it just counts the number of rows in each group.
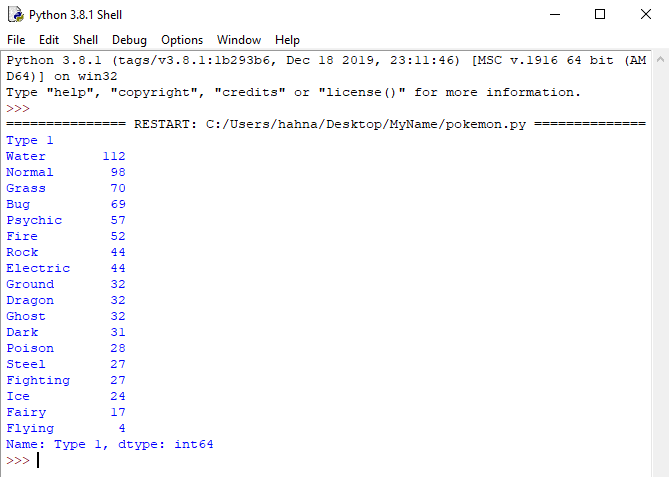
Now we know how many pokémon have different primary types. But it would help if it was better organized. What are the most common types? That's where the sort_values() function comes in handy.
import pandas as pd

poke = pd.read_csv('Pokemon.csv')

print(poke['Type 1'].groupby(poke['Type 1']).count().sort_values(ascending=False))
By specifying ascending=False as an argument in the sort_values() function, the sort will be from largest to smallest.
As you can see, the function calls on our poke dataframe are starting to get fairly long, and they can be hard to understand as they get longer.
One way we can make this simpler is by saving the result of our dataframe into a variable.
import pandas as pd

poke = pd.read_csv('Pokemon.csv')

poke_power = poke[['Total', 'Name', 'Type 1']].sort_values(by='Total',ascending=False)
This new dataframe just contains the columns for the total stats for the pokémon, its name, and its primary type. We've also sorted all pokémon by their total power.
With this simpler dataframe, we can add more filters and groupings to gain more insight without having a neverending line of code. For example, what is the most powerful pokémon of each type?
import pandas as pd

poke = pd.read_csv('Pokemon.csv')

poke_power = poke[['Total', 'Name', 'Type 1']].sort_values(by='Total',ascending=False)
# Will show the most powerful pokémon of that type
print(poke_power.groupby('Type 1').first())

# Will show the least powerful pokémon of each type
print(poke_power.groupby('Type 1').last())
Next, we're going to learn how to clean up our data.
Data Cleanup
Sometimes we need to clean up the data in a data set before we use it. We can save our changes back to the original variable we are using, or create a new variable to store our cleaned data.
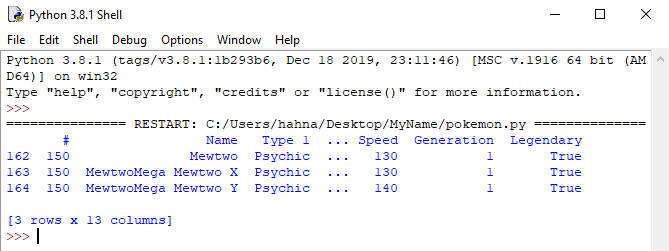
For example, sometimes an individual pokémon has multiple records because they have multiple
forms, but we just want to have that pokémon listed once in our data set.
import pandas as pd

poke = pd.read_csv('Pokemon.csv')

print(poke[poke['Name'].str.contains('Mewtwo')])
We can get a list where there are no duplicate pokémon by using the drop_duplicates() function, and removing any pokémon that have a duplicate '#' field.
import pandas as pd

poke = pd.read_csv('Pokemon.csv')

no_duplicates_poke = poke.drop_duplicates('#', keep='first')
print(no_duplicates_poke[no_duplicates_poke['Name'].str.contains('Mewtwo')])
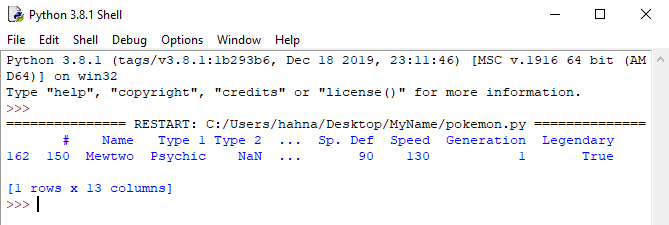
This the drop_duplicates function keeps the first element in the dataframe it finds, and drops all of the others. If you want to keep a different element, you will need to sort your dataframe before you drop the duplicates or change the value for the keep argument of the drop_duplicates function.
Challenge: Pokémon
A pokémon team is comprised of 6 pokémon. In this challenge, you'll create a team of the most powerful pokémon using your data science skills. Then, you'll fine-tune your team based on specific parameters.
If you can master the skills of data science, rather than spending hours looking through your data by hand, a simple one-line change can get you the information that you need.
1. First, select the pokémon with the top 6 stat totals (hint: use sort_values() and head()).
2. New requirement, no legendary pokémon allowed. Before sorting and getting the top 6 results, remove legendary pokémon from the list.
3. New rule: All pokémon on the team must have a different primary type. (hint: use drop_duplicates).
Now you have a team ready to become the next pokémon master! But before you win the pokémon championship, there's another pokémon trainer that could use your data science skills...