Dataset Analysis
This lesson will introduce you to data science and dataset analysis.
What is Data Science?
Data Science is a broad field that focuses on finding and manipulating large sets of raw and structured data.
Raw Data is data that has been collected, but hasn't been put into a usable form for analysis. For example, say you want to analyze a book and how much each character of the book said. Below is a selection from the book Alice in Wonderland:
There was a table set out under a tree in front of the house, and the March Hare and the Hatter were having tea at it: a Dormouse was sitting between them, fast asleep, and the other two were using it as a cushion, resting their elbows on it, and talking over its head. “Very uncomfortable for the Dormouse,” thought Alice; “only, as it’s asleep, I suppose it doesn’t mind.”
The table was a large one, but the three were all crowded together at one corner of it: “No room! No room!” they cried out when they saw Alice coming. “There’s plenty of room!” said Alice indignantly, and she sat down in a large arm-chair at one end of the table.
“Have some wine,” the March Hare said in an encouraging tone.
Alice looked all round the table, but there was nothing on it but tea. “I don’t see any wine,” she remarked.
“There isn’t any,” said the March Hare.
“Then it wasn’t very civil of you to offer it,” said Alice angrily.
“It wasn’t very civil of you to sit down without being invited,” said the March Hare.
“I didn’t know it was your table,” said Alice; “it’s laid for a great many more than three.”
“Your hair wants cutting,” said the Hatter. He had been looking at Alice for some time with great curiosity, and this was his first speech.
“You should learn not to make personal remarks,” Alice said with some severity; “it’s very rude.”
The Hatter opened his eyes very wide on hearing this; but all he said was, “Why is a raven like a writing-desk?”
“Come, we shall have some fun now!” thought Alice. “I’m glad they’ve begun asking riddles.—I believe I can guess that,” she added aloud.
“Do you mean that you think you can find out the answer to it?” said the March Hare.
“Exactly so,” said Alice.
What if you wanted to know how many lines each character said? If you asked a computer to try to interpret this raw data, it might have some difficulty. It would be easier if the data was structured into a format the computer could understand.
Structured Data is data that has been put into a format that is easy for a computer to interpret. After going through this text, here is the structured data based on each line of dialogue and which character said the dialogue.
| Character | Line of Dialogue |
|---|---|
| March Hare, Dormouse, Hattar | No room! No room! |
| Alice | There’s plenty of room! |
| March Hare | Have some wine |
| Alice | I don’t see any wine |
| March Hare | There isn’t any |
| Alice | Then it wasn’t very civil of you to offer it |
| March Hare | It wasn’t very civil of you to sit down without being invited |
| Alice | I didn’t know it was your table, it’s laid for a great many more than three |
| Hattar | Your hair wants cutting |
| Alice | You should learn not to make personal remarks, it’s very rude |
| Hattar | Why is a raven like a writing-desk? |
| Alice | I believe I can guess that |
| March Hare | Do you mean that you think you can find out the answer to it? |
| Alice | Exactly so |
To a computer, this data is much easier to understand. Each line of dialogue is broken out into one row, and there is one column for the character or characters who said the line, and another column for what the character said.
Going from raw data to structured data is not a trivial task. In creating this structured data, the data scientist needed to understand the English language, figure out which quotation marks line up with which characters, and determine when quotation marks meant a character was thinking rather than saying something.
Once you have structured data, it is very easy to count that Alice said 7 lines of dialogue in this section, the March Hare said 5 lines of dialogue, the Hattar said 3 lines of dialogue, and the Dormouse said 1 line of dialogue. A computer could also easily count how many words each of the characters said.
You will need to incorporate many different knowledge areas and skillsets to be a data scientist.
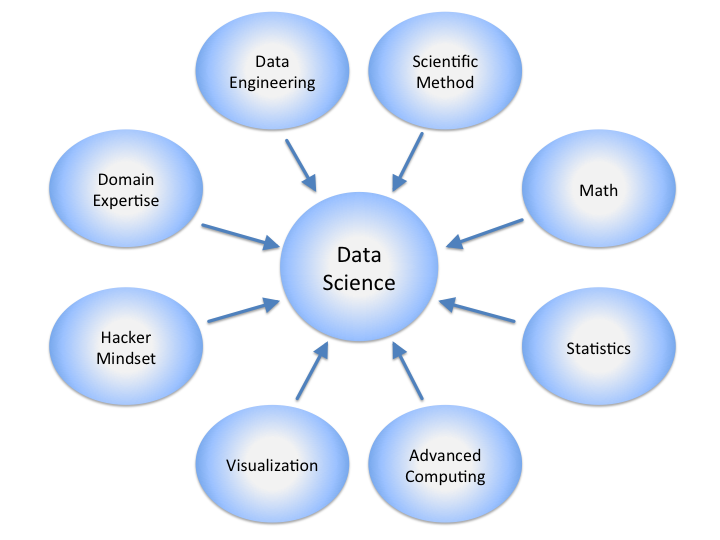
"Data Science Disciplines", by Calvin Andrus, licensed under CC BY-SA 3.0
You will need to use programming and computer science to solve problems that would require too many calculations to solve on your own without a computer.
You will need to understand the domain area that you are studying. If you tried to understand how to structure data in a book that was written in a foreign language, would you be able to do it?
You will also need to use statistics and machine learning to understand the datasets you will look at and have the computer come up with interesting solutions based on having the computer learn about the dataset.
You also need to have great communication skills. It's not enough to gather the data, you need to explain your results to people who many not understand the numerical parts of your results. Often this can mean making visual charts or giving a presentation in front of a large audience about your results.
What is Dataset Analysis?
Dataset analysis is a subset of data science that focuses on processing and performing statistical analysis on existing datasets in order to solve problems.
Dataset analysis is a core part of machine learning. In this course we will use methods to capture, process and organize data in order to explore machine learning and AI.
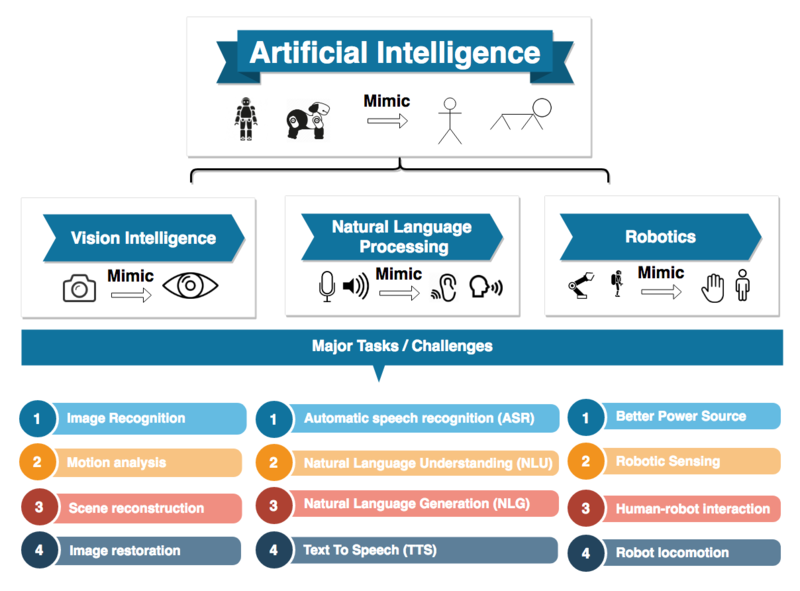
"What is Artificial Intelligence", by Ravirajbhat154, licensed under CC BY-SA 4.0
As shown in the picture above, there are many challenges that AI and machine learning can solve. Most of which come under vision intelligence, natural language processing and robotics.
In the next lesson we will look specifically at natural language processing.
Describing Statistics
A necessary part of working with data is the ability to describe, summarize and represent data visually.
Python statistics libraries are widely used tools that will assist you in working with data.
There are two main approaches to describing and summarizing data:
The quantitative approach
The quantitative approach describes and summarizes data numerically. For example, if you have a dataset of people, you might try to use numbers to describe the dataset. Here's some questions you might want to answer with the dataset.
What is the average age of people in the dataset?
If the dataset includes data about which state they live in, how many people live in each state?
How many businesses and of what type are in each state?
If you're interested in this type of data, the US Census Data for Students Website provides quantitative approach breakdowns for each state.
Quantitative approaches can provide a lot of detailed information, but when you look at lots of numbers on the screen at once, it can sometimes cause you to lose sight of the bigger picture of the data.
The visual approach
The visual approach illustrates data with charts, plots and graphs. Visual approaches usually provide less information than quantitative approaches, but they are easier to understand at a glance.
The US Census website also has a Visualizations section that shows charts of data to you rather than just giving you numbers.
Visualizations can be useful to show complicated concepts in a way that non-scientists can understand. For example, this chart about Changes in Non-English Languages Spoken in the US lets you see which languages are spoken in the US and how their rankings have changed over time. If they wanted to, they could have just provided the raw numbers and let you make your own conclusions. But by creating a chart, it is easier for you to understand the concepts they want to convey to you.
There are many different python libraries that are all useful for analyzing and describing data.
Statistics Libraries
Throughout the course, we will look at many useful python libraries for analyzing statistics and using them for machine learning.
NumPy is a third-party library for numerical computing and working with arrays. Arrays are similar to lists and you will learn about them with NumPy.
Numpy also has many useful functions for statistical analysis.
Pandas is a third-party library for numerical computing based on NumPy. It is great with handling one-dimensional and two-dimensional data.
Matplotlib is a third-party library for data visualization. It works well in combination with NumPy, Pandas and other libraries.
Finding and Reading Datasets
There are many places online that you can find datasets. One site where you can find data is Kaggle, a website which hosts contests for data scientists to create machine learning models.
You can go to their Kaggle Datasets page and look up datasets related to your interests. Below are some examples of datasets. After you get familiar with looking at these datasets, try to use the search functionality to look up datasets relevant to your interests.
In the Video Game Sales Dataset, you can find out which video games sold the largest number of copies.
In the Netflix Titles Dataset, you can find out information about what shows are on Netflix.
In the Goodreads-books Dataset, you can see the user ratings of various books.
Looking at Datasets
It's important that you don't just take every dataset as absolute truth, and apply critical thinking skills when you look at datasets. Here's some example questions that you can ask when you're looking at the dataset.
When was the dataset last updated? If you're looking at a dataset to find the most popular recent books, but the last time the dataset was updated was 10 years ago, will that be good enough for your research?
Does the dataset include lots of null data, or is the dataset complete? Does the null data mean that data is missing, or have a more specific meaning for the dataset?
How large is the dataset? Does it have 100 rows of data, 1000 rows of data, 1 million rows of data? How many rows of data would make you believe it records all the relevant data? If you were looking at a video game sales dataset, but there were only 100 rows, would that be enough for you to draw conclusions about video game sales?
Does your dataset look more like raw data, or like structured data?
How much detail does it include about each row of data? Is any of the detail relevant for your analysis?